Nate Silver Does Spatial Analysis and So Should You
by Brian Timoney
Who’s up for another Nate Silver post?
You know, the guy who single-handedly save America from the pox of Triumphalist Innumeracy. As both a post-Election victory lap as well as promotion tour for his new book The Signal and the Noise, Silver gave a number of interviews that I enjoyed including the one below at Google.

At the 48:10 mark he mentions a project on rating New York neighborhoods, and observes in passing that the per-sqaure-foot cost variation in apartment prices can largely be explained by distance to midtown Manhattan, proximity of (quality) schools, and proximity to parks. According to Silver using just these three variables yielded a r-squared value of 0.93 i.e. 93% of the variation in per-square-foot cost can be explained by the variation in these three variables (a very robust result, by the way). Those of us who work in the geospatial realm typically have a nodding familiarity with distance weighting, hotspot analysis, spatial autocorrelation, etc. But using spatially-derived measures in more standard statistical techniques such as multiple regression strike me as a more likely analytic scenario in the day-to-day “data science” work that we’re all promised is the future.
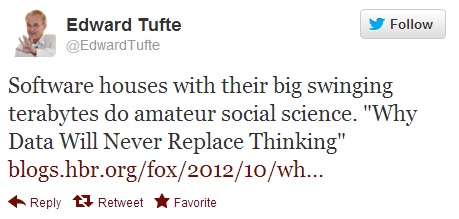
Your “Data Science” is Worth Little Without Clearly Communicated Reasoning
A couple of weeks ago Marc Andressen made headlines by stating that English majors and other humanities types were sentencing themselves to professional futures in shoe stores. As an all-too-typical prejudice of the engineer-centric tech scene, it summarily ignores a piece of the Nate Silver phenomenon every bit as important as his statistical modelling savvy: his writing ability. What set Silver apart was that he was explaining his quantitative reasoning clearly, discussing possible weaknesses of his model, and addressing criticisms of his work all on a daily basis. As a prominent financial blogger noted, the combination of a robust, well-reasoned model combined with a narrative fluency is the true sweet spot. So by all means, sign up for a Data Analysis course and get your feet wet with R, but keep your Chekhov and Munro within easy reach as well. The world is already plenty full of ineffectual factotums bearing scatter-plots getting steamrolled by those comfortably reliant on their lifetime of hunches.
It’s Not About the Size of your Hadoop Cluster
—Brian Timoney

