How the Public Actually Uses Local Government Web Maps: Metrics from Denver
by Brian Timoney
With ever-present budget pressures, GIS heads are wrestling with which combination of server admin and paid cloud subscriptions (ESRI, Google, MapBox, CartoDB, et al) make the most financial sense as well as serving user needs. A few weeks back Tobin Bradley at Mecklenburg County, NC, wanted to determine how visitors used the Google API options such as Street View, Traffic, and Google Earth view. Answer: between 2.2% and 3.5%.
Having real, actual data enables a useful discussion of the ROI of web mapping services. Here in Denver, Allan Glen (Twitter, blog), head of the city’s web GIS team has collected granular usage data that provides a fascinating glimpse into how the public actually uses maps. Starting last April, Denver’s team started rolling out “single-topic” maps (e.g. city parks) as embeddable widgets throughout the city’s website as a complement to the more typical everything-but-the-kitchen-sink map “portal”.
Here’s some of what he shared with your indefatigable blogger:
Metric #1 Single-Topic maps get 3 times the traffic of the traditional Map Portal
Not only do single-topic maps outdraw the map portal at a 3-1 clip, overall web map usage has more than tripled from approximately 25K visits per month to 90K visits a month. Sal in Public Works may love that he has 55 data layers in a single map interface, your public–not so much.
Metric #2 60% of map traffic comes directly from search engine requests.
If you’re lucky, your map portal will have its very own button on the ever-more-cluttered local government home page where every pixel is someone’s “turf” to be guarded with Hunger Games ferocity. Single-topic maps enable more specific SEO techniques so entering a perfectly natural term into Google–“Denver park”–puts the single-topic parks map (“Find a Park”) at the top of the results. Boom! Web maps getting more eyeballs and drawing traffic just like the normal web.
Metric #3 Auto-complete drives clean user queries
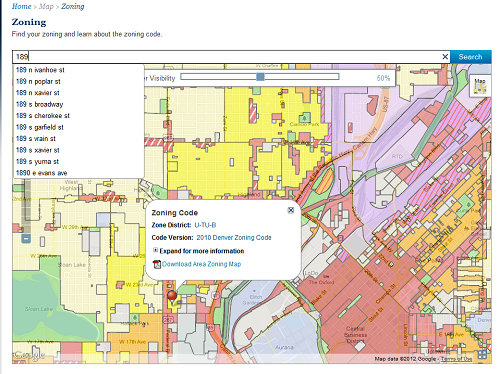
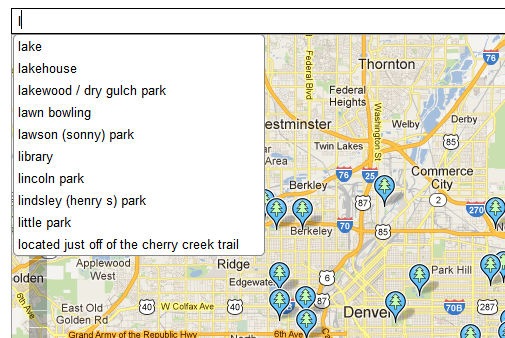
It’s 2012–if you don’t have auto-complete you’re failing your users as they seethe trying to enter their street address or park name EXACTLY as it appears in your precious database. Denver is using the open-source Lucene project and throwing everything–addresses, park names, rec facilities, etc.–into a single entry box with Google-like auto-complete. In Denver the most common request is for “Washington Park”–a yuppie oasis where I’m forced to ponder the dark recesses of the human heart given the preponderance of couples in matching lycra.
Metric #4 Map Usage is Spiky
Elections and snowstorms drive usage spikes. But the biggest one-day pop in map requests? Open Doors Denver–a city-wide weekend celebration of architecture–racked up over 8000 map requests on the Friday prior.
Spiky usage is an additional argument for single-topic maps as the Mac-wielding architecture enthusiasts do not want to sift through your fire hydrant and zoning layers in plotting out their weekend festival stroll.
Metric #5 People Look Up Info on Maps, and Leave
Average map visit time is 1:43. Local government maps are about information retrieval. Once the maps load, users just start clicking on markers at a clip six times greater than entering search terms. Are you zen enough to design maps for users that want to leave quickly?
Metric #6 People Actually Interact with Balloon Content
Of the 1.7M markers clicked in the past eight months, users clicked on 250K hyperlinks inside info balloons.
Metric #7 People Rarely Change Default Map Settings
GIS people love to add basemap options. Users, as we have seen, are looking for information: they toggle from the default street view to aerial or hybrid a whopping TWO PERCENT (2%) of the time.
Oh, and they have no idea what that “full-screen” button does (0.5%)
~ ~ ~ ~ ~ ~ ~ ~ ~
Interesting, no? What’s clear to me is what local government maps need is less GIS and a lot more user-friendly auto-complete and SEO. Because in the end users want search and retrieval to work for maps the way it works for the rest of the web.
—Brian Timoney

