Web Mapping Continues to Pay for the Sins of Internet Explorer
by Brian Timoney
So how have you been celebrating the 5th anniversary of the launch of Internet Explorer 7? For tens of thousands of public sector folk here in the US, they celebrate everyday as IE 7 is the only browser they are allowed to use on the job*. For comparison’s sake, the best-selling mobile phone in 2006 was the Nokia 1600. Now imagine if every mobile app had to be backwards compatible with the most popular cellphone of 2006?
And now you being to understand the rage web developers feel towards Internet Explorer versions 6-8 and the thousands of programming hours spent weekly accommodating their quirks and the 20-25% market share they continue to hold on to in 2011. And knowing that the more standards-compliant alternatives, Firefox, Chrome, and Safari, are freely downloadable makes the despair all the more wail-inducing.
The cool kids, of course, don’t give a thought to those left behind in IE-land and happily embrace the HTML5 future. But we in the mapping world have no such luxury as the very entities most likely to be using retrograde browsers are the traditional users of GIS (read: guv’ment). So there was a big embrace of Flash and Silverlight plugins as cross-browser “solutions”, whose viability ended when Apple decreed no plugins on the iPhone and iPad. The inside joke is that “RIA”, the self-designated acronym for “Rich Internet Application” now stands for “Rich Intranet Application.”
Now let’s indulge in a bit of counter-factual fantasy: it’s August, 2001 and Microsoft announces the launch of Internet Explorer 6 that will support Scalable Vector Graphics (SVG), a W3C standard for drawing vectors in the browser using ordinary mark-up inside an HTML page. Because of performance limitations, the maps made with SVG are limited in the number of features displayed, but nonetheless we start seeing lots of choropleth (thematic) maps especially on election night. Further, the visibility of SVG mark-up via the trusty “View Source” command enables non-programmers to copy professional examples and make their own web pages with custom maps. Personal online diaries, subsequently called blogs, start embedding their own maps and the democratization of cartography gathers even more momentum.
None of this happened.
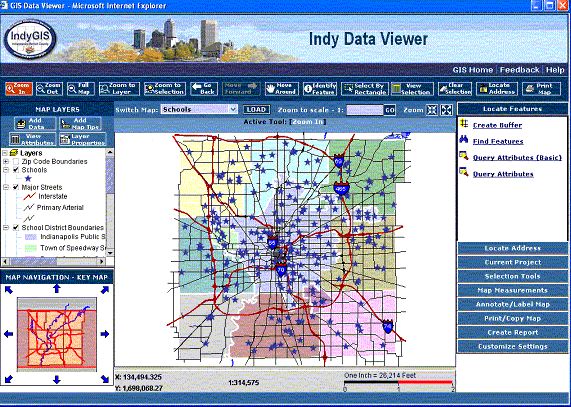
Instead, Microsoft foisted its own preferred standard–VML–and web mapping remained strictly the province of “heavy” server-centric solutions until Google Maps and the mashup revolution kicked off in 2005. With its predilection for over-engineered GIS-inside-a-browser apps, the industry combined evolving server resources with plugins (Flash, ActiveX, Silverlight) to push large volumes of both raster and vector data via interfaces that even today way too many users find bewildering. A side-effect of the industry embracing complex apps is that in too many shops, web mapping became the province of the hired consultant, with the GIS Analyst shunted aside for lack of programming chops. Recent online make-a-map services such as GeoCommons, Google Fusion Tables, and ArcGIS Online are a much-needed re-empowerment of the non-programming web mapper.
In future posts I’ll highlight two new-ish mapping approaches to bridge the worlds of Internet Explorer and the iPad: MapBox and Raphael.js. But in the meantime, while the techno-optimists invoke William Gibson and a future that’s already here, just unevenly distributed, I fear we in the geospatial realm are more haunted by William Faulkner’s observation that “the past is never dead. It’s not even past.”
—Brian Timoney
*Currently the case with my beloved City & County of Denver. Colleague Bill Dollins speaks of DoD shops still using IE 6. Quelle horreur.
