MapBrief™

Geography · Economics · Visualization

Your Online Map Is Missing Half Its Audience: More Revealing Web Analytics From the Field

When recently writing about the shortcomings of map portals, many of my opinions were shaped by the map usage analytics I collected from the City of Denver that formed my most popular post of 2012.  Given the popularity of the topic and the large volume of feedback, I circled back to gather more statistics not only from Allan Glen in Denver, but also Jason Birch in Nanaimo, as well a project in Centennial, Colorado that I modeled after Jason’s approach to property information.

And what I found strengthens the case against map portals.

You’re Missing Half Your Audience

One of the major short-comings of map portals  is that by jamming a variety of layers into a single interface, it’s very difficult to elicit a user’s intent.  Think of how much “smarter” the web is when comparing the Yahoo homepages of the late 1990s with Google’s fast auto-complete text box of 2013.  We fully expect Google to find us the needle in the haystack, yet our map portals do about as well as anticipating what we’re looking for as the old Yahoo home page (which, among those of us north of 40, was regarded with wonder–it’s where we started our online day…!).  Because Nanaimo, Denver, and Centennial all actively use SEO for their geographic content it’s much more search-engine friendly than layers locked away in portals.  Last year we found that 60% of all Denver map traffic came from Google searches: that has risen to be closer to 70%.  Meanwhile, Nanaimo rings in at 60%, while the newest initiative in Centennial is already 50% of map traffic.  (When we say “Google” we mean all search engines, of which Google accounts for > 90% of traffic).

But here’s the important part: these are feature-specific searches. People don’t go looking for map interfaces or map layers, they Google specific addresses, specific school names, specific libraries, etc.

FACT: If you’re geographic data is not Google-able at a feature-level of specificity, you’re missing half your audience

Most People Are Looking for A Single Feature. Then They Leave.

Websites like to brag about how “sticky” they are:  the amount of time spent on the site, how many pageviews generated, etc.  If you’re providing the public information, you are not in the business of being “sticky”: provide what the user is looking for as quickly as possible and let them leave.  And we can see this in the Nanaimo stats.  Jason was one of the first to push the principles of REST for geographic data, and it lets us see the 65% of all users retrieve a single bit of information and leave.  Only 12% of users browse information for more than three geographic features during a single visit.  The vast majority aren’t visiting a public government website to spend time interacting with maps, toggling layers, and clicking on dozens of placemarks.

If you have a cynical cast of mind, you could be thinking “maybe Nanaimo’s content is so useless and confusing people bail right away?”  To that I say, over 10% of their map usage comes from bookmarks and emailed hyperlinks.  Because every feature has its own unique URL, it’s much easier to save and pass around.  Can individual features in your map portal be bookmarked and passed around?


People Who Ended Up Interacting With A Map, Didn’t Go Looking For A Map

Denver’s Recreation Centers map had over 7000 visits in January.  But only 1% of keyword searches that led users to the Recreation Centers map included the words “map”, “location”, or “find”.  So even in their Google searches users aren’t thinking “map”, yet on average they end up having three interactions with the map per visit.  This is more damning evidence against the idea of putting all your geographical information inside a single portal and labeling it “MAP”.

Don’t Make People Find Maps, Put Them Where People Already Visit

The City of Denver’s web GIS team is in an enviable position: not only do they have the solid evidence of the traffic-enhancing presence of maps, they have an embeddable-widget architecture that lets them easily embed map content anywhere on the city’s website (as well as third-party websites).  Most of us have to wrangle with our organization’s jack-booted HTML thugs “web team” to get a single 8pt-font hyperlink on the home page. So when the Presidential election was approaching, they looked at the web stats and saw, unsurprisingly, that the Election Commission homepage was where the majority of the search traffic landed.  Guess what happened when they temporarily embedded a polling location map in that homepage? Election Day and the 24 hours prior blew the doors off of all preceding map usage records.

Beautiful things happen when maps are liberated from the Geo Silo.

The New Marching Orders: Optimize For Single-Feature Search & Retrieval

We already knew that single-topic maps create three times more traffic than the all-in-one portal.  This latest round of metrics clearly shows that users want maps that quickly focus them on a single, particular feature of interest.  Not only do we have to break our portals down and give the most important layers their own maps, we need to enable the user to rapidly pluck out that lone feature that they’re interested in from your haystack of content.  Following the Nanaimo playbook (turn on the ‘notes’) of using REST principles to make every individual feature index-able and bookmark-able, you harness the power of search engines to enable easy discovery and drive traffic to your maps.

As I showed in a previous post, a minimally-viable lookup service based on this individual-feature philosophy can be rolled out at a very low cost.

Next-level flexibility with embeddable map widgets a la Denver enables placing maps where folks naturally end up in searching for information.  This is a positive feedback loop in high gear as you’re capturing a significant audience of people who didn’t even know they wanted to interact with a map.

*  *  *  *  *  *  *

Geographic communication is less about technology and more about anthropology: understanding our audience instead of being preoccupied with our tools is what will enable us to rightfully command a position of relevance in the Information landscape.


—Brian Timoney


haystack photo courtesy of   t_buchtele’s Flickr stream
Boca photo courtesy of   micmol’s Flickr stream

A Minimally Viable Property Lookup Service


A cornerstone of the Lean Startup movement is the idea of a Minimally Viable Product (MVP) whereby a company, instead of spending months (and months) building the perfect product, quickly builds something that has just enough features to be useful, but makes no claims to completeness or finished polish. Instead, getting real feedback early from users interacting with an actual product, one can apply iterative improvements based on user behaviors rather than a bunch of people in a conference room white-boarding theoretical features that would be theoretically cool.

Minimally Viable Products are a bulwark against counterproductive perfectionism and the tendency to keep adding marginally useful features.  As we’ve seen in the Why Map Portals Don’t Work series, web map interfaces tend to be bloated with all manner of content and functionality that distract and hinder the user from carrying out their primary intention of information retrieval.

Below, then, I’ve created a Minimally Viable Property Lookup Service using a half million property records from the great City of Philadelphia. The goal is to create something that a) doesn’t require “Help”  b) enables the user to find information fast c) gives users links to more information and d) requires a minimal investment in tech infrastructure.

Cutting-edge info aesthetics? Um, no.

Without further ado…

Award-winning? No.

Soon-to-be profiled in a glossy industry magazine? Probably not.

Could you find an address quickly?  Probably.

Ingredients

Here’s a rundown of the minimalist ingredients powering the app.

  • SQLite:  the 500K parcels are stored in a SQLite database.  SQLite has a number of important qualities including 1) ubiquitous, especially on cheap web hosting environments such as GoDaddy and InmotionHosting;  2) portable–it’s a single file so you can create and test locally and easily upload to the web; 3) it’s reasonably fast.
  • Address Lookup:  this is the most important part of the app. You can’t have the users guessing about address formats, street types, etc.–let them just start typing and give them very specific feedback as to what options actually reside in your database.  They’ll figure it out.  Our address lookup is rather forgiving insofar as it takes fragments of house numbers and street names–again powered by a basic PHP script searching the address field in SQLite and piping the results into a javascript autocomplete widget. Even though our app is on generic shared web hosting, we’re getting sub-half-second response times: fast feedback is essential for engaging someone used to the Google auto-complete experience.  The indispensable Tobin Bradley has a screencast here on setting up a similar search.
  • “More on this Block…”:  Simple list of hyperlinks that gives the user the quickly check out the tax assessments of your neighbors. Because we’re naturally nosy.
  • Attribute Table: You’ll spend the most time agonizing over the background color of your zebra banding.
  • Disclaimer:  We’re GIS people–we always include a disclaimer.
  • Google Static Map: perfectly in the spirit of a Minimally Viable Product, our map is courtesy of Google’s Static Maps API, just plug in our parcel’s centroid into a request URL and, voila, a map.  Google gives you 25,000 free maps per day (thanks!).

From a techie’s point of view, the above is rather mundane.  But the shocking truth that I’ll expand on in the next post is that the above satisfies the majority of your users. They happily go off to some other corner of the web, content that the information retrieval experience wasn’t too bad.  But for those who need more, we can give them the following without much exertion on our part–

  • Bing Maps KML overlay + print capability:  since most commodity hosting has the bare-bones SQLite 2 installed, we can’t provide much in the way of SpatiaLite magic.  But we can store the KML geometry as text in a SQLite 2 text field (not optimal, but still viable).  And through the magic of URL rewrites, we can make each record in our database “look like” it has its own unique KML file to the outside world.  We simply append an address’ unique KML url to Bing Maps and, presto, we have free interactive mapping that even shows our custom logo (no API key necessary). And did you see we mentioned printing?  FACT:  more tears have been shed by geo-developers creating web-map printing capability than actual web maps printed.  We just offload that headache to the fine folks at Bing and call it done.
  • KML Download:  as long as we have a unique KML “file” for each feature, let the user download it.  And be sure to mention “Google Earth”:  more people know what Google Earth is than know what a KML file is.

Maintainable Over Time?

Any tech manager knows the value of an application isn’t necessarily in its splashy roll-out but in its maintainability over time.  In our set-up, we can use free command-line tools from the aforementioned SpatiaLite project to automatically load a shapefile into SQLite plus execute SQL commands to clean the data up, create a text field with KML geometry, etc.  We have one client who does their updates using DOS commands in a batch file–how awesomely mid-1990s is that?  But it works, and it’s free: everybody’s happy.

Cost Certainty

A significant impediment to adoption of usage-based cloud solutions is that their costs, while low, are variable.  And nothing exasperates managers and accounting departments than unknown month-to-month costs.  I’ve had clients point-blank tell me they can’t move forward with any solution that involved them wrangling with their Accounting Department once a month.  With commodity hosting, you can one-time purchase storage and bandwidth for 1-3 years at one time.  Again, it’s this kind of conundrum that reminds one that the biggest obstacles to progress aren’t necessarily technological but rather the policies and procedures created in a simpler time.

Website Politics

For government entities that don’t run their own website in-house but rather a 3rd party provider with an inflexible content-management-system (CMS), the options are limited for rolling out spatial content.  A minimalist approach that can be easily be embedded via an <IFRAME> (again, a 1990s web thing) is not optimal but given limited options and resources, it works.

The World We Live In

It’s never been easier to distribute large quantities of data–including spatial data–inexpensively to the public.  But a mistake we see too often made is the assumption that anything relating to geographic information automatically requires something called “GIS”.  Users want to find the one needle in the haystack that is relevant to them–fast.  But they certainly don’t want the haystack dumped on their head, which is what too many traditional map portal experiences feel like.

In the next post we’ll be rounding up a fresh set of web map analytics that reinforce the power of simple, fast specificity.


—Brian Timoney


D3 and the Power of Projections

The launch of Google Maps in 2005 brought with it a new way to think about web maps: “tiles”.  Lots of tiles.  Actually, millions of tiles.  The smooth panning and zooming were awesome, but keeping track of all of those 256 x 256px PNG images was, frankly, a chore.  Even with a computer. And the purists amongst us chafed as this mongrel projection “web mercator”–not exactly conformal, not really Mercator–became the de facto standard.

"Web Mercator?" If your loxodromes aren't straight, keep my name out of your mouth.


So what mapping industry titan would rise up and liberate us from the tyranny of web mercator in the browser?

A guy in California who works for the…The New York Times?

D3.js:  Data Driven Documents

D3 is a javascript library that not only does choropleths, proportional symbols, etc. in the browser (no IE 6-8; we can’t wait up forever), but a stunning array of other types of visualizations.  Which is essential because even we mappers realize that sometimes the best map isn’t a map. A Swiss-army knife of data-display possibility to complement our everyday cudgeling of points, lines, and polygons.

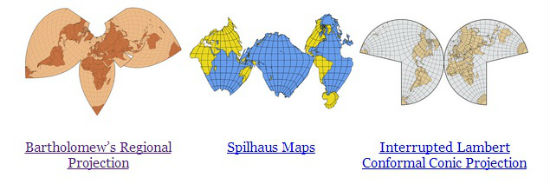
May I Interest You In Some Peirce Quincuncial?


BREAKING:  Projections are back in the browser.

And how!

Those of us of a certain age remember when the education crisis wasn’t basic reading and ‘rithmitic but America’s school children staring at Mercator maps and getting distorted impressions of the relative sizes of continents. And being too impressed with Greenland.  Now we can dazzle impressionable youth with the manifold ways to display an oblate spheroid on a flat screen.

Or heck, just go all in on a spheroid, and spin it, inside your browser.

Cro$$over Skill$

As map-making goes mainstream, geo professionals need to cultivate a skillset less niche and more in demand by those outside the geo silo.  D3–because of its versatility and variety–is much in demand.  A fair grasp of it combined with data munging skills, and you’re looking at a $15K bump in market-value (or your money back).

Small Steps, Incremental Absorption

But that $15K isn’t free money.  D3 has moving parts and a conceptual framework that needs grokking before the cool stuff happens.  Your go-to technique of “COPY-PASTE, TWEAK-‘N-HOPE” isn’t the play here.  Fortunately there are a ton of resources and a new book: with patience and lots of view-source-ing, you’ll be in infoviz-creating mode in due time.

The Tyndale Revolution in Online Mapping

D3 will only accelerate the process that Google kicked off in 2005: the radical democratization of cartography on the web.  In creating the first English translation of the Bible using the new tools of mass publishing, Tyndale effectively broke up the monopoly of the small, elite, Latin-reading guild.  (And got burned at the stake for his trouble–stuff happens.)  Geospatial professionals had a sort of monopoly on map-making: complicated software and obscure data formats kept the guild comfortably small.  Now we see patient explanations of what a shapefile is geared towards the tech-savvy but otherwise uncredentialed outsider. Anyone with a browser and a text-editor can now make compelling maps and distribute them to the utter ends of the earth.  If you’re an industry veteran in this uncertain, sequestered professional environment, you can either devote your energies to pining for a cozy, less demanding past or jump head first into the creative flourishing of a New Golden Age of Cartography that has already arrived.


—Brian Timoney