MapBrief™

Geography · Economics · Visualization

Geo In The Browser: Less IT Means This Time It’s Different

Call me a glutton for tedious text, but I enjoy end-of-year lists, predictions-for-next-year, and yes, the annual family newsletters my friends send me around the holidays. So killing time during a not-particularly-intriguing final Sunday of NFL football, I found in the latest GeoHipster post of 2015 prognostications a couple of worthwhile nuggets.

“…the client side will eat more of the server side stack.”

Thus sayeth Tom MacWright of Mapbox.  And I’m inclined to agree since Geo-in-the-browser was a major trend I spotted at the 2014 FOSS4G conference in Portland.

Not so coincidentally, Mapbox recently blogged their new-ish Javascript library Turf (“GIS for web maps“)–that does spatial analysis functions such as buffers inside the user’s browser (as opposed to a remote server or database doing the calculations).  Very cool–especially when a small handful of spatial operations cover a large amount of use cases.  But this?
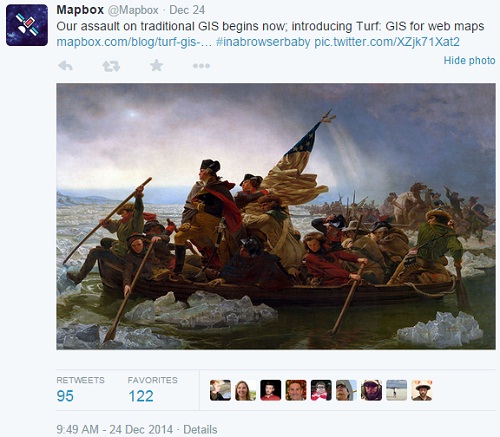
 

Now I like smack talk as much as the next guy–hell, I even like hyperbole–but I’m doubtful that “GIS for web maps” is the most effective marketing tack for “assaulting GIS”.

JavaScript in 2014–Echoes of early 2000s Java?

As it happens, I saw this movie the last time around, when the Java community arrived in the early 2000s and rewrote all of geospatial. The dominant architectural paradigm of the time was the three-tier, built on open standards, and the software all shows it.

That from industry wise-man Paul Ramsey (with whom I occasionally agree).  Again, I’m more than a little predisposed to middle-aged curmudgeonly been-there-done-that finger-wagging.  But yet I’m excited about geospatial analysis in the browser.

Why?

Self-interest, mostly.

I Want Less IT in My Life, and So Do My Clients

 

Even under the most ideal conditions, the coordination costs between IT departments and their internal customers are significant. And conditions are never ideal: we all have our stories–you, me, and every vacant-eyed PM who sits in the chairs pictured above.  But as the outside consultant trying to deliver even a modest solution to a customer, those coordination issues directly impact my bottom line. Negatively.

(Admittedly this says more about my shoddy consulting talents as I’m aware of the fat stacks of cash that await those who figure out how to profit directly from these organizational frictions e.g. <insert large federal government contractor here>.)

In short, if it doesn’t require a server, I can get something to the client quicker and more profitably.  Minus the burden of dealing with their own IT department, my ideal customer will be more likely to embrace iterative development and experimental pilot projects.

(For those of you shouting that The Cloud solves the same problem, trust me, the IT department has an opinion and  even on the cusp of 2015 the middle manager skepticism will be palpable.)

I’m Running This in My Browser: Is It Software or A Web Page?

A taste of what’s to come can be seen in Howard Butler’s plas.io LIDAR viewer.  Just a short time (months?) ago this would have required a software install:  now you can load a not-small LIDAR file, view/manipulate it, and do some analysis all from the comfort of just a single browser tab.  No meetings, phone calls, or emails with the IT department necessary.

Come to think of it, not only will you have to interact less with your IT department, more geospatial capabilities in the browser may also diminish your similarly frustrating interactions with that collective entity known as  “GIS”.

Dare to dream.


—Brian Timoney


Meeting room photo courtesy of  Bankbryan’s Flickr stream


The Elegant, Effective Election Data Visualization That Is Thankfully Not A Map


We occasionally field the suggestion, nay, insinuation, that our posture here at Mapbrief is unduly critical.  Whether it be pie charts, contiguous cartograms, or untucked shirts, our opinions are admittedly fixed. So much so that you might say “dogma”; we say “consistency”.

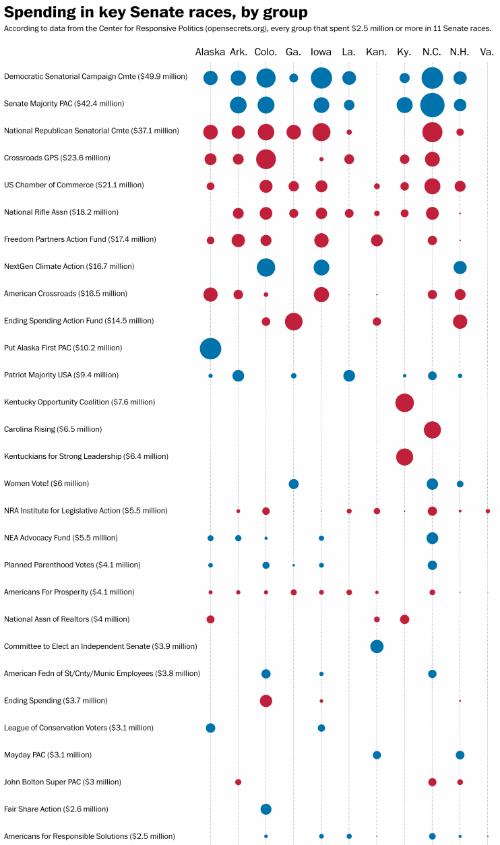
But in the spirit of staying positive, let’s admire this recent graphic from the Washington Post detailing campaign contributions:


Note the five dimensions of information: 1) donor name, 2) total donation,  3) state of Senate race, 4) receiving political party, and 5) relative size of state-level donation. As a bonus, the list is sorted top-to-bottom by total donation.

What makes me especially happy is that I can so clearly picture what this graphic could have been: a map of the US with the 11 states having some choropleth ramp (39 states of “no data”!), with a proportionally sized pie chart atop each state showing the party breakdown.

The horror.

Moral of the story: sometimes the best map is no map.

Great job by the Post team.


—Brian Timoney


Open—Wide Open—in Portland: A FOSS4G Review


Having been to previous FOSS4G conferences—2007 in Victoria, 2011 in Denver—I was eager to circle back to this year’s iteration in Oregon to assess what’s changed, what’s new, and what I can adapt for everyday use in my consulting business.

I. Sprawl

With up to eight tracks running simultaneously, everyone’s conference was going to be different. But knowing that all the sessions would be available on video, one could take more “chances” with the unusual-sounding and catch up later with the more familiar (PostGIS, MapServer,etc. ) later.  Be honest, how many conferences leave you eager to review another few hours of talks a week later?

II.  Open Source Is A Development Strategy, Not A Price Point

The biggest cultural change from 2011’s FOSS4G ?

GitHub.

We all know what open source is and don’t have to address the legacy stereotype of open source participants as an exotic tribe of code natives uncorrupted by the ordinary lures of the market economy.  Everyone has a GitHub account, from your favorite 3-letter acronym government agencies to your other favorite 4-letter geospatial vendor. With this new broad understanding of the open source model comes the opportunity to have a richer conversation about the efficacy, adoption, and sustainability of the tools–themes touched on by keynoter Mike Bostock.

III. Remember the Browser Wars?  The Browser Won.

By far the greatest impression was made by the WebGL and the manifold possibilities of powerful applications that run in the browser with no plugins.  The technology itself is a little trippy with shaders and meshes made up of points, lines, and triangles.  Except you actually want to render your lines as triangles too (don’t ask).

Life was easy when there were hard-and-fast distinctions between Server, Desktop, and Web.  Then along came the mobile web.

Now we have the dominance of the browser.

Database? It’s inside your browser. With spatial features.  That are spatially indexed.

Spatial operations?  Inside the browser. Hefty on-the-fly rendering?  Inside the browser.

Let me throw out three implications:

  • the “basemap” is dead—your whole map, base features and thematic overlays—is being rendered on-the-fly. If we were at the dawn of a new Golden Age of Cartography a couple of years ago, I suspect we ain’t seen nothing yet.
  • the web is no longer synonymous with “connected to the Internet”. The use-case that kept cropping up was the new user expectation that their web app would keep working when disconnected from the interwebs and seamlessly sync with a canonical datastore when connectivity was restored.
  • no install software, because the browser is the operating system.  Anyone whose business required the tender mercies of Enterprise IT to install software will appreciate a more direct connection to end users via the browser. It’s one of those nudges that amplifies open source software’s natural advantages in rapid deployment and fast iterations.

IV.  No Paint-by-Numbers Business Models

Just as diverse as the tools on offer were the ways of incorporating open source to make money.  While funded startups Mapbox and CartoDB certainly commanded a great deal of attention, the true breadth of geospatial open source was perhaps best seen towards the margins.  Cloudant, recently acquired by IBM, talked up its platform in the context of PouchDB and the burgeoning smart car market.  The Climate Corporation, largely fueled by open weather and agricultural data ( acquired last October by Monsanto for $1.1B—yes, that’s a ‘B’ ) presented a bit on better spatial indexing in the Lucene/Solr/ElasticSearch family of search technology. What’s clear is that far from stale cliche of open-source-as-hippie-altruism, FOSS4G encompasses a much richer variety of possible income models than the increasingly cramped GIS-software-and-services subset.

V.  Location, Location, Location

With the logistics of the event well organized from top-to-bottom, I’d be remiss if I didn’t compliment the host city itself.

Sized quite manageably for visitors, Portland is one of the few US cities you can show off proudly to your Progressive Urbanist friends: ubiquitous public transit, Dutch levels of citizen cycling, high taxes, and restrictive zoning (edited for politeness).

And the weather belied the cliched stereotype of the rainy northwest:  a week 80F temps and bright sunshine. Reminded me of San Diego.


—Brian Timoney


Bridge photo courtesy of   Aaron Hockley’s Flickr stream
Netscape photo courtesy of   Toshihiro Oimatsu’s Flickr stream
Paint-by-numbers photo courtesy of   VJ Beauchamp’s Flickr stream