When A Map Goes Viral
by Brian Timoney
For better or worse –ok, worse–CNN’s John King remains the popular face of choropleth mapping in the US for his election night wizardry. (Our friends across the pond definitely have the better of it with the BBC’s Emily Maitlis–I could watch this crisp analysis, touching on the areal unit problem even, for hours.) But with mapping tools such as Google Fusion Tables, GeoCommons, Tableau, et al, now well within reach of non-GIS specialists, we are going to see proliferation of all manner of thematic maps on the web.
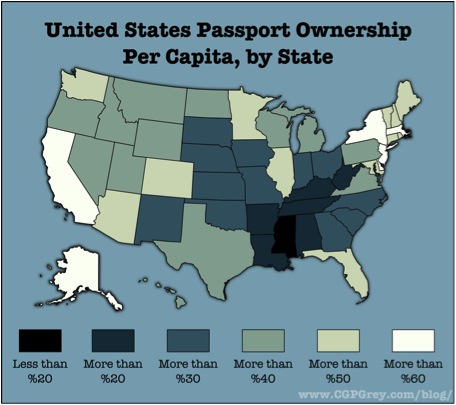
A few months back, a map of US Passport ownership by state, created by CGP Grey, a blogger with no particular mapping background, went viral, getting picked up by The Huffington Post, Andrew Sullivan, and urban theorist Richard Florida, among many others. Of course my professional eye was immediately drawn to some problems with the cartography, but something larger didn’t seem right: frankly I didn’t believe the map. To think that in some of our most populous states (CA, NJ, NY), more than 6 out of every 10 people you pass in the street have a valid passport? That didn’t pass the smell test, and in digging around for answers some larger themes emerged.
First, the obvious carto-geek stuff. A blue color ramp with a blue background? Not recommended. The lighter hues of blue being associated with higher values should be reversed–increased saturation should reflect “more” of whatever variable is being mapped. If casual mappers take any tip to heart, it should be to visit Colorbrewer.org to get solid color ramps with which to represent your data. The data breaks chosen work pretty well: round number increments that don’t confuse the viewer while showing the variation in the data, especially the states at each extreme of the distribution.
As for the data, the blogger should be give major props for explaining his assumptions and linking to a Google spreadsheet of his data. Since state-level data was only available for 2007-2010, he extrapolated backwards another six years (passports are valid for 10 years) to get his estimates. But in 2007 there was a major change in US policy where, as part of the Western Hemisphere Travel Initiative (Orwell-speak alert), passports were made mandatory for travel to Canada, Mexico, and parts of the Caribbean. Using 2007-2010 as a baseline then skews the numbers upwards: indeed his estimate of overall number of passport holders (@ 149M) is about 30% higher than the actual aggregate number (114M) found here. More importantly, our map no longer says what we think it says since the high estimates would be concentrated in states that border Mexico and Canada, or have a disproportionate number of residents who travel to the Caribbean (think of the immigrant populations of NJ/NY/FL/IL). This fixation on the data is admittedly pedantic, but the map becomes significantly less compelling once these factors are weighed.
~ ~ ~ ~ ~ ~
But let’s not bury an amateur mapper. Because in the cutthroat competition for attention on the Internet, he absolutely nailed it: he found a dataset others found compelling and mapped it in a way where dominant patterns were quickly perceived. Bluntly put, people inferred the story he was trying to tell. In our world of ubiquitous data the skill of visual storytelling, especially on the ADD savanna of the web, is something we who “do” cartography and GIS on a daily basis would do well to ponder more deeply in our everyday work.
—Brian Timoney
