MapBrief™

Geography · Economics · Visualization

“Finally: the election map that isn’t a lie.”

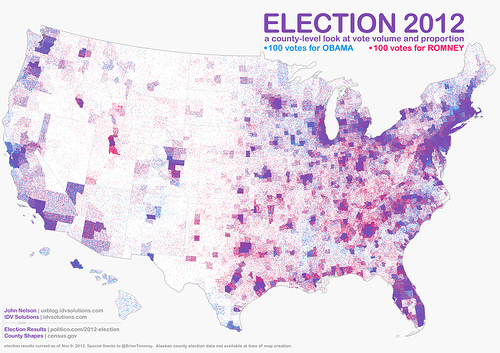
Best-selling science writer James Gleick refers to this map by John Nelson a bunch of us were linking to over the weekend (click for larger version):


Dot-Density, FTW

Based on similar work by Kirk Goldsberry, John took county-level data and posted a red dot for every 100 votes for Romney, a blue dot for every 100 votes for Obama.  The map effectively preserves the familiar geography of the continental US while accounting for the wide variation in population density.  Further, areas of electoral dominance by each candidate are easily identified, while the hues of purple effectively communicate mixed voting preferences.


The Limited Usefulness of Cartograms

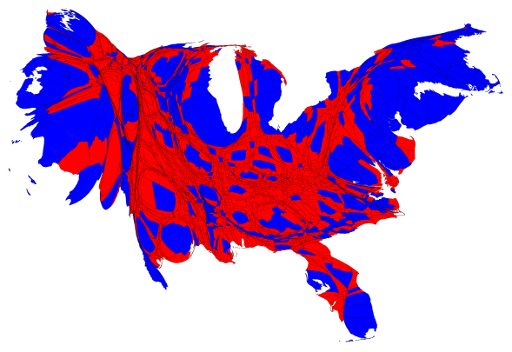
I recall cartograms rising to prominence in the wake of the 2004 election with the maps of Gastner, et al at the University of Michigan. Mark Newman has continued that work and put out maps for the recent presidential election.  Here’s his cartogram based on county-level data:

In my mind, the cartogram is most effective in counteracting the visual dominance of the large “red” states in the middle of the US that tend to be more sparsely populated than the more densely populated coastal areas that often vote Democrat (in cartography-speak:  the areal unit problem).  But in re-shaping areas based on population, the cartogram runs up against a severe cognitive limitation:

Humans are really bad at visually comparing areas of shapes

Or, to put it another way,

HUMANS ARE REALLY BAD AT VISUALLY COMPARING AREAS OF SHAPES

This inability to accurately compare relative sizes of 2-D shapes are what make pie charts such a flawed approach to comparing quantities.  Add in the irregular shapes of counties, let alone the audience familiarity, or lack thereof, with the actual county sizes and shapes, and you’re left with a visual that doesn’t easily lend itself to close, prolonged inspection.

Contrast it to John’s map where the viewer is invited to closely inspect and discover all sorts of interesting patterns:  the reds of Appalachia, the blues of the 19th century slavery belt, the surprising purple found in the Salt Lake City metro area, etc., etc.


Who Decided Democrats are Blue and Republicans are Red Anyway?


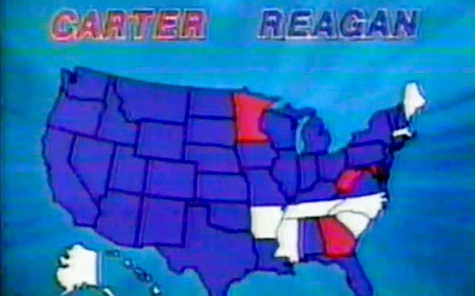
Interestingly there is no Constitutional amendment decreeing Democrats be depicted in blue and Republicans in red.  This interesting Smithsonian post claims it wasn’t until 2000 that the familiar color assignments became the de facto standard and set the stage for all manner of sociological comparison.


Elections Are Good For Mapping

High profile elections raise all cartographic ships. Friends and family mention specific maps they’ve seen in the media, etc., and we in the industry try and soak up the vicarious admiration.  And the maps that stand out, such as John’s, invite others to share in the intellectual satisfactions of geographical exploration that led so many of us to make this avocation our vocation.


—Brian Timoney


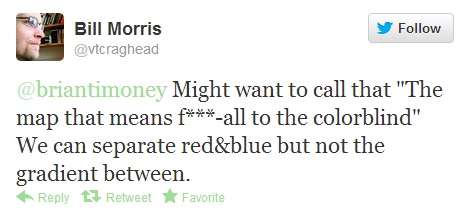
UPDATE:  A valid criticism has been lodged–

In 2012, the color-blind are America’s forgotten 8%.

If “Spreadsheeting” Isn’t a University Major, Then Why Is GIS a Major?

The Excel spreadsheet is the world’s most popular way to capture, store, manipulate, analyze, manage, and visualize data.  Yet I’m unaware of an accredited institution offering a four-year Bachelor’s degree in Spreadsheeting.  Yet replace “data” with “geographic data” in the previous sentence, and suddenly everything is different?  Why is that?


Variation on a Theme

In a previous post, I described how the GIS industry’s insistent self-definition imposes significant hidden costs on organizations where anything spatial is silo-ed of from mainstream IT. More importantly, it limits the career horizons of its practitioners (except advanced programmers) with a disparate set of skills not readily acknowledged nor as financially rewarded in other sectors of the information economy. While the theme of self-definition resonated with some, others were more dismissive of this latest round of bloggy navel-gazing.  But semantics do matter: from job descriptions to salary requirements, language frames our place in the professional world.

But just as incumbent vendors have a vested interest in the “GIS” acronym, so too do the colleges and universities marketing their GIS curricula too often strewn with glorified software training and ossified best-practices packaged as education.

And their customers are the least equipped to judge the quality of goods on offer…


A GIS Major Will Get You an OK First Job

…but a GIS Minor Will Get You a Better Second Job

In the post-9/11 geospatial boom, entry-level GIS jobs were especially plentiful and being a GIS Major was an easy ticket to such a job.  And thankfully we still live in a world where being young, carefree, and pulling low 30s money can be a happy life indeed.  But when looking to take the next step in tackling bigger analytic challenges with a concomitant boost in salary, there are precious few non-programming opportunities to climb out of the GIS Analyst salt mines.  No, you want to have a body of specialized, domain-specific knowledge that is supplemented and enhanced by GIS know-how: let’s not confuse the yeast for the bread.

(Domain Experience + GIS)   >   (GIS + domain experience)

Domain knowledge–detailed knowledge plus experience–is the best insurance of employ-ability over a career that will be rife with technological change.  Leavening domain expertise with geospatial know-how with GIS skills–manipulating spatial data, performing analysis, and creating sound cartographic representations–is a huge value-add.

But don’t confuse the means with the end:  your domain knowledge is the end, your GIS skills just a valuable means to that end.

 
“So…What Should I Major In?”

The wonderful thing about the geographic sensibility is that it’s never been more needed than right now to address any number of “real world” problems.  A couple of months ago a colleague asked me about going back to school for a GIS Certificate.  I told her she’d be much better served by a studying Urban Storm-water Runoff and supplementing that know-how with a mix of in-person and online geospatial courses.

That joke was funnier before Hurricane Sandy.

But think about it: from urban impervious surfaces to coastal dune restoration, our world doesn’t lack for challenges.  Pick a challenge that gets you excited and deep-dive on the technical detail.  With the ubiquity of the web, there is no worry of being too niche:  Google, LinkedIn, etc. guarantee that even with the most eclectic subspecialty, the three-dozen people equally as interested can find you with a few keystrokes.


“Simultaneously Trivializing and Complicating GIS”

That is how long-time educator Joseph Berry recently summed up the state of GIS education.  Berry’s primary concern is that the analytic power of GIS has been eclipsed by the tools of GIS: spinning globes, ever-smaller GPS units, and, of course, The Cloud.  Berry proposes what he calls “Spatial STEM” (see–language matters), where geographic reason and spatial quantitative methods inform and broaden problem-solving approaches in engineering, mathematics, and statistics. Again, another implicit acknowledgement that the parochial self-definition of GIS hampers its own widespread adoption.


Your Transcript is Not Your Destiny

One of the wonderful aspects of the mapping industry is that it attracts a broad range of eclectic minds. Some of the brightest lights have university backgrounds in art, music, history, mathematics, etc.  With a broad curiosity and an ability to focus, you’d be amazed how rapidly one can adopt and master tools.  Does this render GIS coursework less useful?  Of course not.  But while GIS as an end-in-itself may help you land that first job, your career trajectory is best powered by a large passion to solve a difficult problem.  And as recent events on the East Coast have reminded us, some of society’s most daunting challenges will demand a geographical rigor and an analytical insight that goes well beyond mere tool proficiency.


—Brian Timoney


* colored keys photo courtesy of  Theen …’s Flickr stream
* stairwell photo courtesy of the seir+seir Flickr stream
* post-Sanday Rockaways photo courtesy of the  SpecialKRB Flickr stream

If Mapping is So Big, Why Does GIS Feel So Small?

With the arrival of autumn my Saturday afternoon meditative trinity of couch, college football, and napping is occasionally interrupted by one of those IBM Smarter Cities commercials. Though I’m generally irritated by anyone cheerfully telling me they’re building a “smarter planet”, I find the case studies interesting enough for 30 seconds of my attention. Their website has additional info on their urban problem-solving–infrastructure, public safety, education, etc.–invoking terms such as sensors, analytics, and modeling. You know what term doesn’t come up in their pitch?

GIS

Despite the inherently spatial nature of their problem solving, when smart, handsomely remunerated folks such as IBM show little interest in an acronym that supposedly defines an industry, I take notice.

How then are we to reconcile the increasing prominence of mapping with the ever-more-obvious inadequacy of the ‘GIS’ acronym?


GIS as a Desktop Paradigm

We all learned the textbook definition of GIS being a system of storing, manipulating, analyzing, and displaying geographic information.  In a workstation/PC world, having these disparate functions in one place made eminent sense.  With the ascent of the web, and now mobile, GIS has remained a steadfastly desktop paradigm with its nested-menu workflows, file-based data management, export-to-PDF outputs.  To be clear, this market isn’t going away:  indeed the embrace of the GIS paradigm by state/local government + DoD/DHS  mean a continuing stream of entry-level analyst jobs calling for tasks that haven’t changed dramatically in 10-15 years.  When a vendor touts new Excel-to-map functionality in 2012, it’s like Microsoft MapPoint 2003 never happened, let alone that little beta project known as Google Fusion Tables.

 
Geodatabase Management is to Database Management as Military Music is to Music

The continued presence of GIS database middleware in an era where SQL Server, Oracle, and Postgresql/PostGIS all come equipped with native spatial capabilities (the latter two handle raster) has important consequences. First, DBAs in IT want nothing to do with GIS implementations mediated by quirky middleware.  So all of that training and background in database management best practices, etc. doesn’t reach the GIS department.  Instead some GIS analyst with time-in-grade but with little database background and less SQL, is “managing” geospatial data via wizards and dialog windows.  In our era of “endorsed skills” in LinkedIn, GIS remains the only branch of IT where folks talk confidently of database experience without having a rudimentary grasp of SQL, let alone views, triggers, and other everyday DBA tasking.

The Enterprise has Yet to Reckon With the Costs of the GIS Silo

…and they’re staggering.

We talked about geospatial having its own special databases siloed off from IT’s primary database cluster.  But let’s not kid ourselves: what ends up in the geodatabase is a fraction of an enterprise’s valuable spatial data. Behold the typical  C:\ drive in a GIS shop:   shapefiles, MrSID files, and linked Excel spreadsheets ( attributes!).  Because that’s where we do our everyday work (“what if the SDE goes down?”).

In the Utilities and Oil & Gas sectors, they talk about the “Big Crew Change” when the Baby Boom cohort retires en masse.  Leave aside the institutional knowledge and the informal know-how that only comes from experience:  think of the disk drives.  Tens of millions of dollars worth of information left behind as files fall innocent victims of lax data management inside the GIS silo.


GIS Doesn’t Grok the Web

Try finding the “authoritative” version of your property boundary on the Internet. Your county has an enterprise geodatabase and a bewildering map portal, that may or may not be linked from the local gov homepage that channels www.yahoo.com circa 1997.  How about Googling your address?  Sorry, real estate folks figured out the web long before GIS people, and they have the SEO to prove it.  Web users come to us for (quick) information, but instead we too often we give them…

Geographic-Information-System in-a-browser™

When Google Earth and Google Maps stormed onto the scene, GIS professionals sniffed that it wasn’t “real GIS”. Of course, Google proved the masses didn’t mind that it wasn’t real GIS–whatever that was–and their basemaps and new easy-to-use file format KML led the web mapping revolution.  GIS seems slowly to be letting go of their fascination with portals by making it easier to publish to the web directly from, you guessed it, the desktop.

With wizards and such.

The GIS Career Trajectory Ends Up In a Cul-de-Sac

By all accounts, GIS is a “hot” field: especially with the DoD/DHS post 9/11 environment, entry opportunities abounded.  Leave aside what’s happening with government budgets at all levels, simply sidle up to an industry veteran between, say 35 and 45, and simply ask “how’s it going?”  Because the fork in the mid-career road leads to either “Programmer/Developer” or “Project Manager”.  And because GIS operates in its own silo-ed world away from IT, you might have worked with geodatabases but don’t know SQL or may have published web maps but don’t know much Javascript/CSS.  Suddenly spatial doesn’t feel so special.

This announcement or GIS Coordinator in Steamboat Springs is all too typical:  a variety of disparate responsibilities and a large breadth of technology with a salary that doesn’t make it to $60K.  But look at the requirements for  SDE Administration and Versioning.  Imagine instead whether had experience in administering an Oracle Spatial database using SQL and mainstream DBA practices.  A few years of that under your belt and you’re looking at $90K plus you’re liberated from the expectation of administering the HP Plotter (as listed in the above job announcement).  The GIS silo:  relatively painless to enter, but an all-too-easy place to stagnate.


Who Will Tell The Kids the Future is in Databases, Algorithms, and Visualization?

Anyone who works in technology has to be prepared to be whip-lashed by change. But those who make money imparting wisdom and skills to the younger generation have a particular obligation recognize the contours of the new landscape.  I sense that students planning to enter the job market of 2014 will be largely equipped with a 2004 set of problem-solving skills.  This will be the subject of a future post.


*  *  *  *  *  *  *

An Acronym Falls Victim to the Law of Diminishing Returns

Spatial analysis,”location”, “geospatial”, and mapping will only increase in prominence and importance.  But to continue to jam all of that manifold possibility into a fusty, catch-all acronym may serve as a convenient marketing hook, but the costs to our companies and our careers of this self-limiting definition of what we do are too significant to ignore.

The future has a way of arriving on one’s doorstep without calling ahead, albeit not neatly packaged nor clearly labelled.


—Brian Timoney
 

* desk photo courtesy of the atomicules Flickr stream
* flourescent warehouse photo courtesy of the LabyrinthX Flickr stream
* cul de sac photo courtesy of the mdmarkus66 Flickr stream
* tunnel photo courtesy of the kh1234567890 Flickr stream