MapBrief™

Geography · Economics · Visualization

How the Public Actually Uses Local Government Web Maps: Metrics from Denver

With ever-present budget pressures, GIS heads are wrestling with which combination of server admin and paid cloud subscriptions (ESRI, Google, MapBox, CartoDB, et al) make the most financial sense as well as serving user needs. A few weeks back Tobin Bradley at Mecklenburg County, NC, wanted to determine how visitors used the Google API options such as Street View, Traffic, and Google Earth view.  Answer: between 2.2% and 3.5%.


Having real, actual data enables a useful discussion of the ROI of web mapping services. Here in Denver, Allan Glen (Twitter, blog), head of the city’s web GIS team has collected granular usage data that provides a fascinating glimpse into how the public actually uses maps.  Starting last April, Denver’s team started rolling out “single-topic” maps (e.g. city parks) as embeddable widgets throughout the city’s website as a complement to the more typical everything-but-the-kitchen-sink map “portal”.

Here’s some of what he shared with your indefatigable blogger:

Metric #1   Single-Topic maps get 3 times the traffic of the traditional Map Portal

Not only do single-topic maps outdraw the map portal at a 3-1 clip, overall web map usage has more than tripled from approximately 25K visits per month to 90K visits a month.  Sal in Public Works may love that he has 55 data layers in a single map interface, your public–not so much.

Metric #2    60% of map traffic comes directly from search engine requests.

If you’re lucky, your map portal will have its very own button on the ever-more-cluttered local government home page where every pixel is someone’s “turf” to be guarded with Hunger Games ferocity. Single-topic maps enable more specific SEO techniques so entering a perfectly natural term into Google–“Denver park”–puts the single-topic parks map (“Find a Park”) at the top of the results. Boom! Web maps getting more eyeballs and drawing traffic just like the normal web.

Metric #3    Auto-complete drives clean user queries

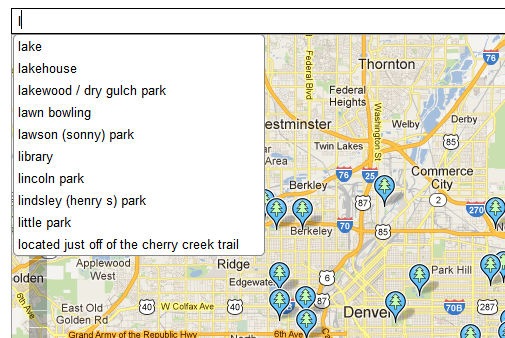
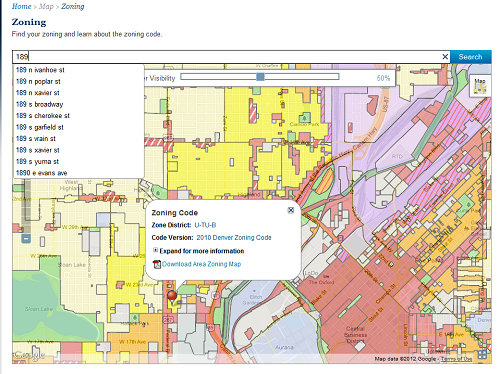
It’s 2012–if you don’t have auto-complete you’re failing your users as they seethe trying to enter their street address or park name EXACTLY as it appears in your precious database. Denver is using the open-source Lucene project and throwing everything–addresses, park names, rec facilities, etc.–into a single entry box with Google-like auto-complete. In Denver the most common request is for “Washington Park”–a yuppie oasis where I’m forced to ponder the dark recesses of the human heart given the preponderance of couples in matching lycra.

   In 2012 auto-complete in non-negotiable


Metric #4   Map Usage is Spiky

Elections and snowstorms drive usage spikes. But the biggest one-day pop in map requests? Open Doors Denver–a city-wide weekend celebration of architecture–racked up over 8000 map requests on the Friday prior.

Spiky usage is an additional argument for single-topic maps as the Mac-wielding architecture enthusiasts do not want to sift through your fire hydrant and zoning layers in plotting out their weekend festival stroll.

Metric #5 People Look Up Info on Maps, and Leave

Average map visit time is 1:43. Local government maps are about information retrieval. Once the maps load, users just start clicking on markers at a clip six times greater than entering search terms. Are you zen enough to design maps for users that want to leave quickly?

Metric #6 People Actually Interact with Balloon Content

Of the 1.7M markers clicked in the past eight months, users clicked on 250K hyperlinks inside info balloons.

Metric #7 People Rarely Change Default Map Settings

GIS people love to add basemap options. Users, as we have seen, are looking for information: they toggle from the default street view to aerial or hybrid a whopping TWO PERCENT (2%) of the time.

Oh, and they have no idea what that “full-screen” button does (0.5%)

~  ~  ~  ~  ~  ~  ~  ~  ~

Interesting, no? What’s clear to me is what local government maps need is less GIS and a lot more user-friendly auto-complete and SEO. Because in the end users want search and retrieval to work for maps the way it works for the rest of the web.


—Brian Timoney
Software Can’t Transform Organizations That See Data Merely as a Thing to Be “Managed”

All words are prejudices.

-Nietzsche

The first problem with Data Management is that it’s called “Data Management.”

In the NFL there is a certain type of quarterback about which the best that can be said is that they are “game managers“. Their talent lies not in a strong arm or pinpoint accuracy but in not fumbling, not throwing interceptions, not taking sacks–in short, they stay within themselves.

These quarterbacks don’t win games for teams; they just try not to lose them.

Not wholly unlike the corporate attitude towards Data Management: don’t be too much of a burdensome cost-center, don’t lose anything too important, don’t get in the way of employees “doing their job”. The most important data (at least what was considered the most important data sometime in the early 1990s when the Sun Sparc workstations were purchased) is coerced into the third normal form relational database, with everything else being dumped into folders on the shared drive.

                                  the Data Management team, hard at work

While billion-dollar companies have sprung up that have data management at their very core–Google, Twitter, Facebook, LinkedIn–far too many self-styled ‘real-economy’ firms allow their employees view Data Management as the grown-up equivalent of eating one’s vegetables or cleaning one’s room.  I once witnessed the head of an Engineering Department declare that if anyone wanted his department’s files uploaded to the new 7-figure document management system, they better hire some college kid interns and leave his people alone.

The best-laid schemes of mice and men, etc.

Software’s power and promise is ever on the increase.  But I have yet to see it triumph over an internal corporate culture where workers have been conditioned to see Data Management as someone else’s problem. Big rewards await whomever can figure out how to motivate employees to organize and annotate the work that puts food on their table with the same gusto that they take the unpromising ephemera of their personal life to construct an online “social presence”.

Until then, competitive peril awaits those firms for whom “Data Management” is a separate, named thing, distinct from how they drive profits.


—Brian Timoney

It’s Never Been Harder to Make Money in GIS: The Sobering Economic Backdrop to the ESRI/GeoIQ Deal

So ESRI buys the cloud-ish start-up GeoIQ:  why should anyone but the twittering class care?

Because it’s the latest sign there are exactly two pathways to profitability in traditional GIS:  be niche, or be ESRI.  You’ve known for the last couple of years that State & Local budgets are decimated, now that same terrible swift sword is menacing the final redoubts of fat geo profits: Federal defense and homeland security.

So one can log onto FedBizOpps.gov and see name-brand contractors chasing sub-$50K work alongside the mom-and-pop shops–fewer dollars and way more hustle and sweat. Or, alternatively, call your buddy at GeoEye and casually ask how things are going.

        Fierce jostling around a trough that's getting smaller


In GeoIQ, ESRI gets a two-fer.  First, with their GeoCommons platform, they bring a lot of proven expertise as to how ArcGIS Online should work.  But more importantly they have sexy buzzword-y stuff (Big Data, Social Sentiment Analysis, Node.js) ready to go.  As the industry heavyweight, ESRI can turn that secret sauce into multiple 8-figure contracts over the next 24-36 months.  As a small startup, GeoIQ could only make a small fraction of that money, as James Fee so bluntly observed.  Nimble and agile are great for innovation, but it takes a peculiar type of heft to deal with the federal government at its most profitable levels (just ask Google).

So where does that leave you?  Developing a domain-expertise niche, teaching yourself Python, or furiously updating your LinkedIn profile?  In a couple of weeks ESRI will have their annual pep rally, for which they have fire-hosed us with some cringe-worthy ad work.  But pay attention to the attendees not going to sessions:  middle- and senior-level people facing college tuitions and the dawning realization that deck chairs are at a premium. Picture beverages, tight smiles, and gallows humor as to how it’s really going out there.

Disruption feels great when it’s happening to someone else’s industry.


—Brian Timoney


* image courtesy of the crazynd Flickr stream