Redistricting Denver: Where “Communities of Interest” Allow Polite Folk to Sidestep Race, Class
Tonight in Denver, the City Council will take final public comments on its plan for redistricting. Comments will be limited to 3 minutes. As someone who has been closely involved in the process and drafted one of the plans dropped from consideration earlier this month, I have more than three minutes of opinions to share…
~ ~ ~ ~ ~ ~ ~ ~
With the decennial redistricting process winding down in most states (or headed to the courts), one conclusion seems fair: the democratization of map-redistricting technology has not led to an increase in democracy. Maybe the opposite. As a longtime political veteran laughingly recalled, when redistricting was done by colored pencils and hand-held calculators, compromise was baked into the process because “no one wanted to redo the maps all over again.” My hunch is that the process would’ve benefited from lively argument with a single set of colored pencils rather than dueling mouse-clicks in isolation.

In addition to population re-balancing, contiguity, and compactness, redistricting brings into play political leanings, race, socioeconomic status, and cultural markers such as language. All of these ingredients are lumped into a potpourri collectively referred to as “communities of interest.” On one hand there are easily discernible city/county/town boundaries that already demarcate groups, and compiling party registration statistics for further differentiation is easy enough. But race, social class, and the voices of the newly arrived?
Silence descends.
And it’s an awkward silence.
To aid jurisdictions in complying with the Voters Rights Act of 1965, the Census publishes detailed block-by-block race/ethnicity counts. So if social class and culture come up at all, it’s through the imperfect analog of race statistics. But in reaching into the tangled skein of communities of interest, there’s a decided preference for a single objective criterion we can all agree on and tacitly avoid those conversational third-rail topics we reflexively shunt aside. In state-wide redistricting battles, political party affiliation is the obvious proxy, especially in our time of heightened partisanship.
* * * * * *
Here in Denver, a majority Democrat city, the go-to criterion for drawing around the communities-of-interest conundrum is neighborhood boundaries. No, not neighborhood organizations that meet regularly to hash out common areas of concern, but rather the city government’s statistical neighborhood designations which are as much about record keeping as they are symbols of geographic self-identification.
To understand the more technical tricks of the redistricting trade, I recommend the Redistricting the Nation white paper put out by my mapping colleagues at Azavea in Philadelphia. Because the techniques of gerrymandering that we associate with the non-intuitive shaping of districts (e.g. California congressional districts) also can be used with a defter touch to more subtly alter the voting dynamics of a district.
Five Easy Pieces: Flipping a District
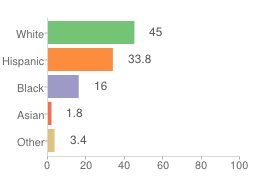
The art of flipping the racial/ethnic mix of a district is to leave the representation of surrounding districts relatively unchanged. Taking a closer look at the draft plan that is the last map standing after the April 9th meeting (and has been the clubhouse leader since the process began), we find the historically Latino District 9 of North Denver–now gentrifying–with a mix that currently looks like this:
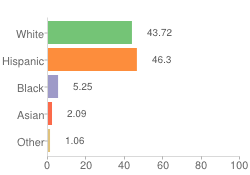
Note: the colors on the chart are the same colors to denote block-by-block race and ethnicity in the maps below.
Step 1: Draw the most politically engaged Latino precincts in with highly engaged upper-middle class white voters
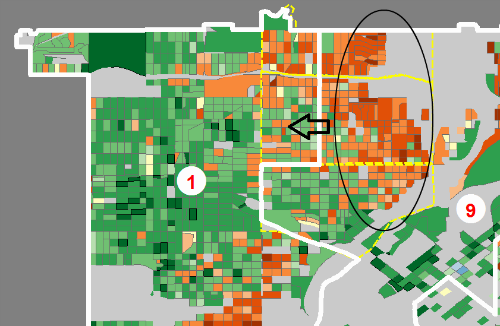
With District 1 needing to add population in order to balance, the push east seems a natural choice especially with gentrification at work in this area. The voter participation of the Latino dominated precincts is relatively high, but now they are drawn into a district with an intensely political upper-middle class white community. But the statistical neighborhood boundaries (in yellow) are being honored, so in isolation there’s a rationale at work.
Step 2: Split a Statistical Neighborhood to ‘Fix’ the Numbers
Having expanded District 1 aggressively eastward, its now both over its allowable population quota as well as having its white plurality jeopardized. So, where to trim?
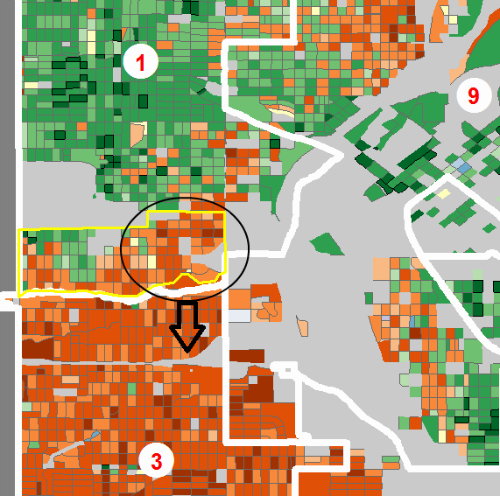
In claiming the unification of statistical neighborhoods as the primary desideratum, it’s more than passing strange that to “make the numbers work”, a previously unified neighborhood (in yellow) is split. Not only is it split, it’s split along race/ethnicity lines with the predominantly Latino half of the neighborhood being packed into overwhelmingly Latino District 3. Again, there’s no argument that, in isolation, it doesn’t make sense to group ethnically similar areas together, but considering race and class only when expedient smacks of…political opportunism?
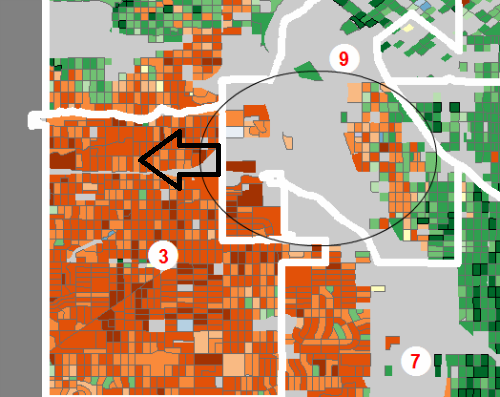
Step 3: Pack More Latinos Into An Already Majority Latino District
To shave off the southern portion of District 9, the mostly Latino precincts are packed into District 3, which is approximately 3/4 Latino already.
Step 4: Warehouse the Overflow from the ‘Latino’ district in Adjoining White Plurality District
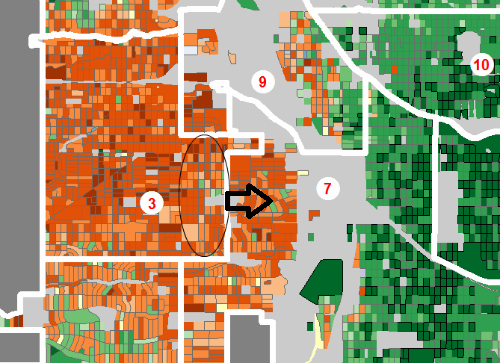
All of this packing of Latinos into District 3 pushes their total population over the allowable limit, requiring the cracking of a few precincts to be moved to the white-plurality District 7 to the east.
Step 5: Expand East to Pick Up More Favorable White & Black Precincts
Having shaved off predominantly Hispanic precincts to the west and south, District 9 can now be expanded east to pick up more demographically favorable white and black neighborhoods.
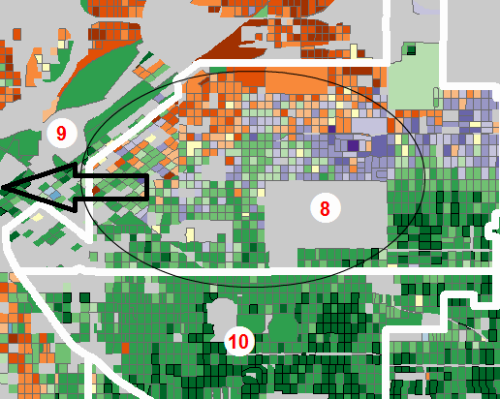
While we have focused on the dilution of Latino voting power, another interesting dynamic is that the decreasing Black population of Denver (approximately 9% of the city) is being further fragmented, presumably for the short-term interests of incumbents directly involved in the drafting of the map (see “victory, Pyrrhic“).
The Result:
All of this trimming, packing, and shifting flips a Hispanic district to a White district. Making the margin even more comfortable is that a good portion of the Latinos left in the district are in poor, politically isolated neighborhoods (and physically isolated by virtue of being cut off from the rest of the city by an interstate). And to reiterate, all of this was done without changing the racial/ethnic plurality of any of the adjoining districts.
Another unique element of the process is that the drafting of redistricting plans is done by members of City Council themselves. (As far as I know, I was the only outside consultant hired by a councilperson to help draft a plan). Not staffers, no outside commission, but rather councilpeople themselves pointing and clicking away. Having such a direct say in redrawing their own re-election prospects evokes the dynamic of the famous Marshmallow Experiments.
But given the optics of the decisions above and the dramatic shift of the city’s political geography that’s been in place for forty years, surely there would be a conversation to thoroughly air the issues as to why a minority population making up 30% of the city manages a plurality in only 18% of the city’s districts, right?
Nothing To See Here, Please Disperse
At the suggestion that the redistricting plan on the table was less-than-kosher with respect to Latino voting power, the reaction was less “this is something we need to take a look at” and more that polite decorum had been rudely breached. Not only does Denver have a black mayor, but our progressive, forward-looking city is no place for the messy racial politics of the past. So sayeth our white politicians and political insiders, anyway.
Even the city’s flagship newspaper took pains to reassure the readership. In a Sunday editorial it expressed “concern” with this race talk, then gravely noted this factoid:
Let’s keep in mind what the demographic trends in Denver truly are. The city is getting whiter.
Now let’s assume that you read your Sunday morning paper in slippers with coffee in hand, but regrettably without Census statistics within arms-reach. What would you infer the numbers to be behind such a statement? Would they look something like this?
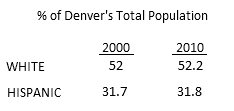
Lazy or disingenuous? It’s so hard to tell in a one newspaper town.
~ ~ ~ ~ ~ ~ ~ ~
Beyond the minutiae of local politics, the plethora of maps, and the mind-numbing calvacade of Census statistics what’s been notable is the energy expended to declare that the political discussion is not a discussion about race and class. After all, they’re merely one subset amongst a vast array of “communities of interest”, right? (As an unaffiliated voter, I look forward to the local Democrats shaking their own Etch-A-Sketch as they pivot from declaring that the Latino vote is just another interest group for redistricting purposes, but then lavishing attention in seeking their energetic participation to swing a key battleground state in the November election.) While minority candidates being elected mayors and President are surely markers of progress, can we now claim to be “post-racial”? As for social class–for which Americans have never had an accessible vocabulary besides the throwaway that we’re all generally “middle-class”–the economic indicators all point in the direction of increasing stratification. All of which begs the question why we’re so eager to banish these issues from our politics.
—Brian Timoney