MapBrief™

Geography · Economics · Visualization

Geographically Balancing Supply and Demand: Car Sharing in Denver

How do you geographically match supply and demand in the new sharing economy?

For lodging, the old way was to have a fixed number of hotel rooms whose prices rise as the beds fill up. The new way is having AirBnB email potential providers of rooms and informing them of demand spikes in their local area and providing price forecasts from their in-house demand models.

In transportation, the old way was fixed bus routes on set schedules supplemented by a taxi fleet whose supply was limited by a medallion/licensing system.  Should there be a spike in demand, you’re either standing inside a packed bus or waiting a long time for a cab.  The new way is for an Uber or Lyft to text its drivers that demand is high and urging them to go out and server high-demand areas while at the same time applying surge pricing to customers–tweaking both supply and demand to bring them into balance.

So it was a very specific spatial curiosity that drove me to find out how car2go vehicles moved throughout the Denver area given that a) vehicles can be picked up and dropped off anywhere in the service area and b) there is a flat per-minute/per-hour rate no matter the day or time of travel. In short, how well does this system spatially match supply and demand?

The following is an excerpt from a more in-depth report you can get here.

By the Numbers

  • Over 176,000 car movements noted between August, 2015 and January, 2016 by snap-shotting the public availability map every 10 minutes. We have no actual trip data or actual routes–trips are merely inferred from the public map.
  • Around 340 vehicles are available throughout the service area on any given day.
  • Typical trip was between one and two miles.
  • Typical car makes three trips per day.
  • Trip destinations concentrated downtown and in the immediately adjacent neighborhoods.
  • 41% of trips occur during weekday rush hours (7am – 11am, 3pm – 7pm)
  • 7% of trips start and end within 200m (“errand trips”)

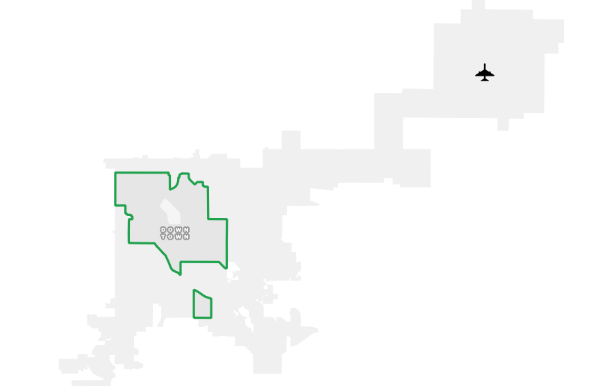
Map:  The Service Area

During the study period, the car2go service area consisted of central and northwest Denver neighborhoods as well as an area around the University of Denver in the southern portion of the city. A recent expansion of the service area reconnected the southern portion with the main service area: an obvious improvement in network connectivity.
 

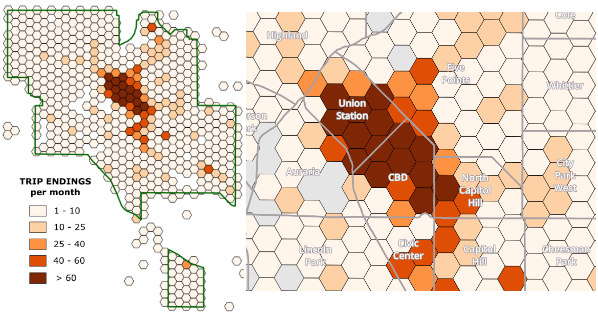
Map:  AM Rush Hour

Weekday morning trips are heavily concentrated in the downtown business district. One of the benefits of car2go is that you can park at metered spaces for no charge–a huge convenience and a topic I take up in depth in the full report (click here).
Map:  PM Rush Hour

In the afternoon, we see a more dispersed pattern of trips downtown and the nearby neighborhoods. We see notable concentrations in Five Points along the Blake St/Walnut St corridor as well as the North Capitol Hill/Capitol Hill neighborhoods which have the highest density of housing in the city.
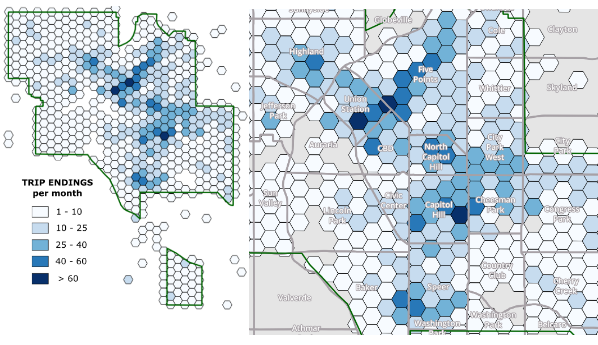
Weekend/holiday patterns are roughly similar to the PM rush hour pattern and are covered in the full report (click here).

**Note: the hexagons outside the service area boundary represent particular car2go pickup/drop-off points usually at public transportation locations, entertainment venues, etc.

Map: Car Turnover

Given the pattern above of AM concentration of destinations and PM dispersion, we can infer where cars would turnover the quickest, but how different is the turnover time in neighborhoods farther from downtown?

Very different.
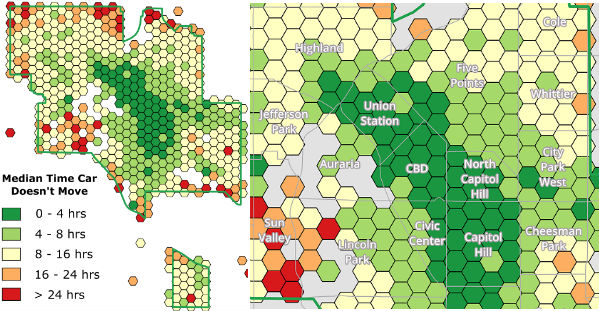
This map highlights the key challenge of the car2go business model:  when a service charges a single price regardless of the time of day or the driver’s destination, spatial imbalance is the very predictable result.  Bike-sharing programs exhibit similar behavior, but those networks can be re-balanced by trucking a large quantity of bikes around the city throughout the day.  Re-balancing an automobile network by using employees to drive cars to busier locations is much more costly.

More maps and analysis can be found in our full report here.

Dynamic Pricing and The Driver-less Future

One of obvious remedy for the spatial imbalance of the car2go network is to have a pricing system that more flexibly responds to where cars are “stranded” and incentivize users to drive them to more high demand areas. That’s great in theory, but as Uber’s experience with surge pricing has shown, folks don’t much like supply-and-demand if it means they perceive they are paying “more than they should”.  And think about the demands car2go already puts on its user base:  i) users have to open an app or map online to figure out where are an available car may be and ii) users then have to navigate themselves to the car. As someone who thinks about map interactivity and navigation everyday, I assure you these skills aren’t as prevalent among adults in 2017 as you may suppose.  Adding in another layer of dynamic pricing may very well just create more customer service headaches than a more spatially balanced network is worth.

By now you probably have guessed what the ultimate answer will be to geographically balancing a car sharing network:  self-driving cars that can move themselves into areas of high demand. What we have now are opaque economic models with implicit subsidies e.g Daimler providing the cars for its own service in car2go’s case while oceans of venture capital subsidize every Lyft and Uber ride.  All of it feeling like a scramble to establish network effects before the dramatic changes the shift to self-driving cars will bring.

Get the full in-depth report here.
 

— Brian Timoney 

Denver photo courtesy of  Ken Lane ‘s Flickr account

Timoney Group’s “Hot” List for 2016

We here at Timoney Group headquarters in Denver aren’t above a SEO-pandering listicle–we’ve done it before–and you clicked, so we’re all good.  If you follow tech closely, much of what follows won’t be “new” per se, but the context here is things/trends that could deliver real value to our clients in ways they may not have considered.

Jupyter Notebooks

Code, data, and visualizations–all in one place.

notebooks

Stop right there.  If you’re like me, keeping stuff organized is a PITA difficult and time consuming.  If you’re working with clients iteratively, or passing stuff back and forth with a collaborator, the Dropbox tango becomes bloated and fraught.  Everything in one place, runs in a browser, supports multiple programming languages–that’s the beginning of what the Jupyter project brings to the table.

The bigger picture is that while our roots are in Geospatial, much of what we do can comfortably fit under the ever-growing umbrella of Data Science.  And the notebook is the format of exchange, whether the underlying code be in Python, R, whatever.  While its roots are in academia (originally as the IPython project), it has heavyweight support from IBM, Microsoft, Google, GitHub, et al: that’s good enough for us and our customers.

AWS Lambda

For most of us, using the Cloud has meant just having a server or cheap disk space Somewhere Else, with performance monitoring and management limited to determining whether the monthly bill from Amazon “looks right”.

lambda

The Lambda offering is what we really want from the Cloud: purely on-demand, with provisioning and scaling being Not My Problem. And dirt-cheap.  Since a lot of the value we deliver is essentially along the lines of “Where is x?” or “What’s close to here?”, it lends itself well to building out small, manageable location services that don’t need a server being “on” 24-7.  For those of us who didn’t get into tech to be Systems Administrators, dispatches from the land of the Server-less Startup make for giddy reading.

Matt Perry has a nice write-up of using Lambda to create a simple raster-to-vector geospatial conversion: it should get your gears turning.

APIs of APIs

If eleven years of consulting has taught me anything, it’s that small- and medium-sized businesses vastly underestimate the amount of Technical Debt they are accruing with their internal, custom-coded applications.  If you’re a Project Manager, the question of “how we can build this?” should really be “how can we build this with the absolute minimal amount of custom code?”  With the mainstreaming of SaaS (e.g. Salesforce), we’re preaching the gospel of linking these services’ APIs together using platforms such as Zapier.  For many, being able to send text alerts to workers in the field based on changes in a Google Spreadsheet made back at the main office is indistinguishable from magic.

plumbing

We have white-boarded for 2016 a very lightweight asset tracking system that will link together a phone’s location, its camera as a QR code reader, a Google spreadsheet as the “back-end” database, a live map hooked to the Google Sheets, and SMS messaging based on geographic triggering with the goal of less than 100 lines of custom code.  Wish us luck!

Dead Simple Mobile Apps

Have you heard about the importance of Mobile?  Me too.  More than once.  But I’m not talking about the iPhone, or Android, or even PhoneGap.  I’m talking a text.

Like, works on a flip phone.

text

Given my background, when someone asks me a data question I naturally want to answer with a map.  And in recent years that meant an online, interactive map.  Yes, we love Bootleaf because it’s the easiest way to get our interactive maps to work on a variety of devices. But to often they’re messing with something that’s too interactive as they pinch their screen in vain searching for that ONE data point that actually matters to them.

Well, let’s use the power of computers to figure out what that ONE data point is and serve it up to them in the most user-friendly format of all: a simple SMS text.

 *  *  *  *  *  *  *

One could summarize the marching orders for 2016 as being “instead of trying to impress other techies, let’s simplify, and then simplify some more until a paying client looks us in the eye and says we’ve gone too far.”


Brian Timoney is an information consultant in Denver, Colorado.

notebooks photo courtesy of Jose Camões Silva’s Flickr stream
birds photo courtesy of Sigfrid Lundberg’s Flickr stream
plumbing photo courtesy of Russ Morris’ Flickr stream
cell phone photo courtesy of Ken Banks’ Flickr stream

5 Mapping Industry Trends I Saw At JS.Geo

philly_vtcraghead_sm

Wait long enough to blog a conference, and you’ll find others have beat you to it.  Bill, Derek, and the folks at Cesium have done a great job with both talk-by-talk reviews as well as a few big picture reflections here, here, and here.  In addition, we posted most of the talk decks/links here.  As co-organizer of the event (along with Chris Helm), the weight of logistical concerns tends to crowd that mind.  But all that being said, there were five themes I saw throughout the day that are worth sharing.

Mapping Platforms Are Ready For Big(ger) Data

Whether through GL libraries (CesiumJS, Mapzen Tangram), advanced techniques for handling heavy time-stamped data (CartoDB Torque), or the newest take on vector tiles (Mapbox, ESRI), the industry has the capabilities in place to display larger volumes of data in more interesting ways. We all like novel maps, but a truly useful future is probably a combination of Platform + Data + Visual Grammar that isn’t quite in place yet.

Turf.js, Everywhere

A benefit of putting on the 3rd iteration of JS.Geo is that you get to see the new “cool” stuff of past conferences become mainstream.  Turf.js–think spatial analysis in the browser–popped up repeatedly in a wide range of demos.  As a developer, there’s much to be said if you don’t need a server to calculate a buffer. But put your point-in-polygon logic in your phone browser that works disconnected from the Internet? Now we’re talking muddy-boots geography out in the field!

muddy_boots

Node.js As Back-End Workhorse

Node–server-side Javascript–always gave off the whiff of an edgy t-shirt, not-freshly-laundered. But it’s not just for the hip startups anymore.  We saw old school enterprise-y shops using Node for everyday data processing tasks (data never comes into this world clean, shiny, and usable).  As a consultant sensitive to how daisy-chaining tools together can spawn nasty Technical Debt through a mishmash of programming languages, being able to use Javascript for back-end grunt work as well as the usual front-end browser stuff has interesting efficiencies.

Mappers Are Coming From Everywhere

We can debate all day the pros and cons of making maps without a traditional background in GIS and Cartography (that’s what Twitter is for, right?).  But the fact is the field has never been more diverse with new mappers often going to school in the halls of Github and StackOverflow. I, for one, welcome the new state of affairs if only for the pleasure of regularly pointing out to these new carto-apprentices that ‘choropleth’ has only one “l”.  

But would I have thought of wiring my map navigation to an arduino controller?

No, no I wouldn’t.


Everyone Is Hiring

Even the one guy who said he wasn’t hiring is now hiring.  So yeah, everyone is hiring–coding + geo talent is at a premium.

We’ve been saying this for years, but it bears repeating:  if your daily routine has you doing geospatial work strictly through GUI-driven desktop software, the impact on your future earnings is clear and unmistakable.

 *  *  *  *  *  *  *  *  *

Chris and I want to thank the 26 speakers who presented.  

We especially want to thank our sponsors for making it financially viable.  

jsgeo_sponsors_4


new4

If nothing else it enabled us to offer darn good sandwiches.

Oh, and thanks to the guy who picked up the tab at the after-gathering!

Brian Timoney is an information consultant in Denver, Colorado.


Philly skyline photo Bill Morris
muddy boots photo courtesy of Leszek Leszczynski’s Flickr stream