MapBrief™

Geography · Economics · Visualization

In Praise of the Static Map

You need to make a map.

And you want to use the web.


If you’re a geospatial professional it’s likely you misapprehend the task in 3 crucial ways:

  • You will  underestimate the time it will take to create an interactive map using one of the usual Javascript mapping APIs.
  • You will overestimate the amount of time your audience will spend using your map.
  • You will overestimate you audience’s enthusiasm for “interacting” with your map.

If time is money, then my money-making advice to you is…embrace the Static Map.


The Browser is Your IDE

If the phrase “Integrated Development Environment” doesn’t ring any bells, then Static Maps are a great place to start web mapping.  Most of the well known services have Static Map APIs–Google Maps, Mapquest, Bing, Mapbox, et al–that are driven completely by URL strings entered into your browser.  You simply specify parameters for height, width, zoom level, coordinates of your point/poly/line overlay, color, etc. , etc.

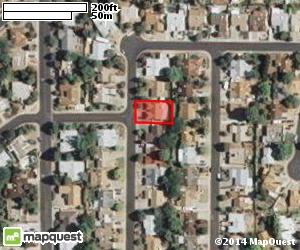
So, for instance, let’s draw a polygon around Walter White’s house in Albuquerque, New Mexico.


This is created simply using these URL parameters–

http://open.mapquestapi.com/staticmap/v4/getmap?
size=300,250
&type=sat
&zoom=17
&key=<your key here>
&center=35.126,-106.5366
&polygon=
color:0xff0000|
width:2|
fill:0x44ff0000|
35.126018,-106.53676,
35.126012,-106.53636,
35.126207,-106.53636,
35.126213,-106.53676,
35.126018,-106.53676

Fairly straightforward, no?  And since fundamentally what you’re doing is string manipulation, the door is open for you to become the danger by making URLs in bulk using some Excel CONCATENATE fu.

You are the Web Mapper Who Knocks.

Saving Time Means Getting Real

Many of my client needs include maps that the intended audience will spend about 8 seconds looking at.  Sorry, but 8 seconds of viewing time means it’s not worth my time to cook up pretty D3 or fancy interactive controls.

Besides, they don’t know what those controls mean.  Or how they work on their phone.

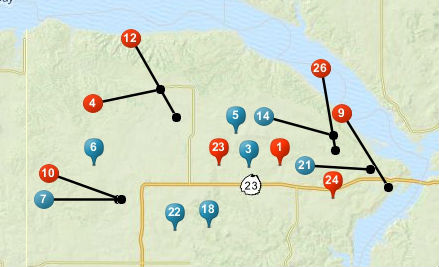
So here’s a swatch of oil well drilling activity in North Dakota:  note that the (Mapquest) static map API automatically de-clutters the points for me.  In real life this means I run dozens of these maps every night and I don’t have to qa/qc them.  More rem sleep is a win for everyone.

82.3% of Interactive Maps Are Used To Make Screen Captures*

(*invented statistic)

Another unpleasant truth that web mapmakers dare not admit to themselves is that a depressingly large percentage of people use web maps to manually create screen captures to insert into a PDF or PowerPoint.

So let’s do them a solid and save them from MS Paint by giving them the static maps they really want.

If we have some basic coding chops we can make pretty PDFs (who doesn’t love a PDF?).

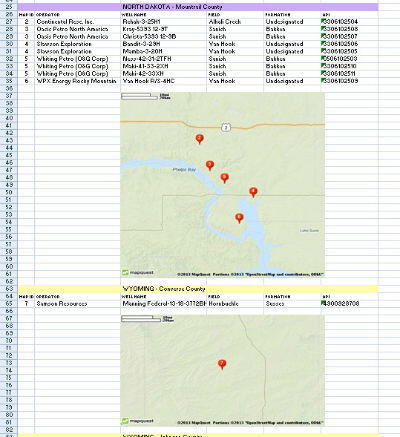
But with a little scripting elbow-grease we can also go to 11 by embedding maps inside Excel spreadsheets:


In this use case, the attribute data is as important as the geography–by simply scrolling down in Excel they can absorb and mentally filter on multiple variables all while sipping contentedly on their morning coffee.

When I suggested on Twitter that embedding static maps inside Excel workbooks represented cutting-edge Geo Business Intelligence, I received this glowing reply:


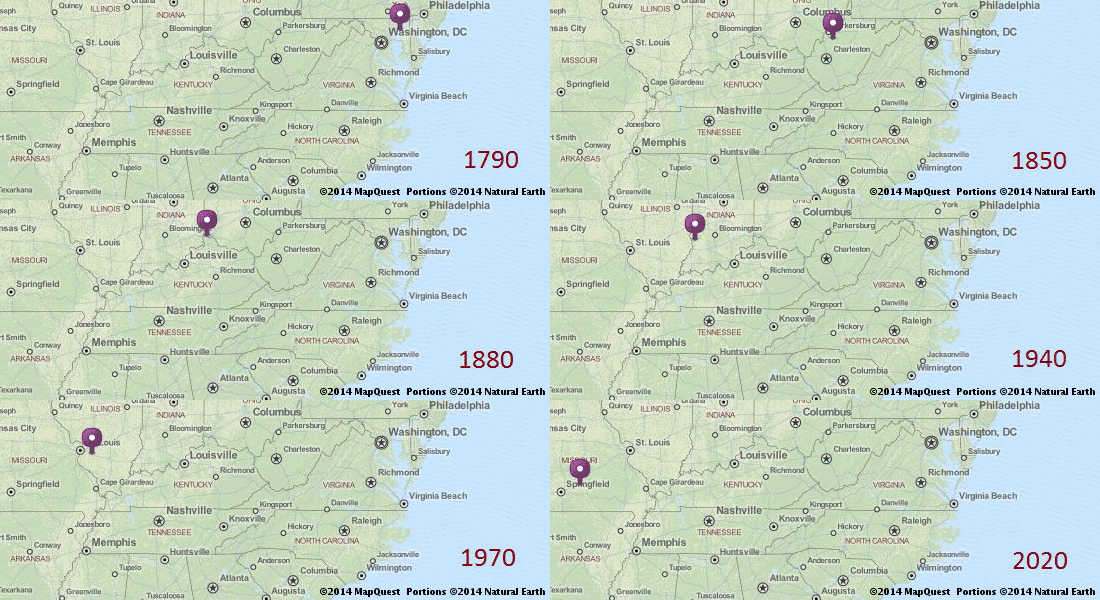
Hands-Free Time-Series Cartography

Because hating animated GIFs is hating life itself.

(Mean center of US population 1790-2020)


—Brian Timoney


Marc Pfister created a Google Maps Static API playground to help you get started.


Twisted watch photo courtesy of   Metrix X ‘s Flickr stream


MapBrief Geo Predictions for 2014

Soothsaying is so much part of the human condition that, like so many pointless pleasures, ancient scripture took a very dim view of it.

But for us in tech glib optimism is the default setting.  Piggybacking on the predictions of others in the geo industry, I offer the following the prognostications based on little other than personal bias:

 
1) Geo Will Continue to Grow; GIS Market Share Will Continue To Decline

Geographic data, spatial analysis, and cartography will all enjoy an increase in financial investment and general public awareness in 2014.  But the percentage of this content generated by traditional GIS software will decline.   The spatial-isn’t-special mantra becomes entrenched as interesting geo applications increasingly “happen” elsewhere such as

  • in databases unmediated by geo middleware,
  • custom search applications powered by Solr/ElasticSearch et al
  • statistical analysis packages such a R and the emerging Python ecosystem
  • purely in the browser via Javascript APIs and visualization libraries

Even better from the end-user perspective, instead of the brickwork of cryptic icons that passes for UI in the GIS realm, mobile apps will demand of their users little more than having their phone turned on.

But worry not GIS worker: spatial might no longer be special but projections, datums, and legacy file formats will continue to be very, very special.

2)  Remote Sensing Becomes Something Other Than Background Images

All hail the Geo-Panopticon.

Check out this image of Singapore harbor (2nd image down):  it’s a little bit cool.  But the quicker re-visits promised by newcomers Skybox Imaging and Planet Labs mean new products to tell us just where each of those ships in the harbor has been and help us track where they’re going to. Or at least that’s the hope for an industry that’s still all-too-dependent on government clients.


3)  Postgresql Becomes the Default Choice
 
2014 is when conventional wisdom catches up to what we PostGIS users have long known:  PostgreSQL is the sh#t.  As platforms such as EC2, OpenShift, and Heroku make it dead easy to spin in it up, we’ll look on with abject pity at the devs making do with MySQL on their $3.99/month commodity shared hosting.

 
4)  The “Enterprise” Won’t Move As Fast As You Want It To

Sure, they’ll continue to say the right things: “breaking down silos”, “getting smarter with data”, etc., etc.  But you know what’s more powerful than the new possibilities unleashed by technology?

Human inertia.

Or, more specifically, the entrenched interests embedded in a calcified org chart.  Thus the magical thinking of “we’re going to do all these wonderful things with data that will increase profits and efficiency without threatening the status quo.”

Because “disruption”, like “minor” surgery, is best experienced by others.   When you are a middle manager being kept up at night by the ghosts of Future College Tuitions, non-threatening nibble-around-the-edges small improvements expensively offered up by your friendly long-time vendor are preferable to anything that has even a whiff of cutting-edge.

5)  Hadoop Will Become Even More Beloved Among Those Who Don’t Have Big Data Problems

The vast majority of organizations do not have Big Data problems.

They have small and medium data problems.

These everyday small and medium data problems usually aren’t difficult technical problems per se: they’re often solvable with database and ETL tools already on hand, perhaps with a dash of statistical analysis.  But like in #4 above, they face the formidable foe of status-quo processes and the executives that cling to them.  Om Malik has a wonderful post about how everyday customer experiences remain un-informed by the unsexy data that companies have been collecting for years.

All that said, we’ll grant you that ‘Hadoop’ is still a fun word to say.

*   *   *   *   *   *   *

On the other hand, the combination of the Apple iWatch and the next iteration of Google Glass could be the game-changers that we’ve all been waiting for.

If so, I’ll gladly issue a breathless retraction of all of the above.


—Brian Timoney

Crystal ball photo courtesy of   spratmackrel’s Flickr stream
Elephant watercolor courtesy of HikingArtist.com ‘s Flickr stream


One Man’s Public Comment: “More Data, Less Infrastructure”

A thought experiment:


A well-meaning colleague, knowing you’re the “map person”, approaches with a seemingly straightforward request.

“Where can I get the most up-to-date file of the official US state boundaries?”

There are dozens of places to get such a file–but the most up-to-date?  Wanting to save professional face, you surreptitiously google “us states shapefile” and see the following top three entries:

  1. a 163 kb file from ESRI, undetermined date
  2. a 23 mb file from NOAA, 1:2M scale, “Valid date–2012”, Last modified date–2007
  3. two choices from the National Atlas: 1:2M 6.8mb file dated June, 2005; 1:1M 10.6mb file dated July, 2012.

And that, in a nutshell, is a problem that a National Spatial Data Infrastructure (NSDI) should solve, right?

*   *   *   *   *   *   *

The FGDC recently released a NSDI Strategic Plan draft document for public comment. And I was informed I was supposed to have an opinion. So your dutiful blogger, reluctantly disturbed his summer reverie by downloading the PDF and had a look.

What I found was a combination of geo-is-important boilerplate and marketing copy for a technology called the Geospatial Platform. When I see 10 bullet points for “The Desired Future State of the NSDI”, I wonder if we’ll end up any closer to solving our “most up-to-date US state boundaries” conundrum. Given the documented shortcomings of past FGDC performance  I imagine my skepticism is broadly shared.


Infrastructure? We Have Infrastructure Everywhere


I’ve covered in the past how we’re in an era of unprecedented private sector investment in spatial data infrastructure (see–Google, Apple, Microsoft). So when I read

“The National Spatial Data Infrastructure extends far beyond data”

my reaction is let’s not extend anywhere until we get the data piece right.

This suspicion of scope creep is deepened when we read that

“the Geospatial Platform initiative is a critical component for the continued development of the NSDI.”

What exactly is this Geospatial Platform?

“The Platform is a Web-based first generation service environment that provides access to a suite of well managed, highly available, and trusted geospatial data, services, applications, and tools for use by Federal agencies and their State, local, Tribal, and regional partners.”

That there is some enterprise-ready commercial vendor marketing copy.

The larger point is the FGDC should only have a single-minded focus on data, and leave the tools and applications to others. I’m happy to pay my Water Utility bill every month, but I don’t need them selling me my bathroom sink as well.

What’s Missing

Do a word search of the proposal and you know what terms don’t come up?

“search engine”

“GitHub”

The failure of the geospatial community to search-engine optimize its content is why when you google your address you’re much more likely to find real estate content than, say, the property boundary from your county GIS department.  To Geospatial Professionals™ “authoritative” means accuracy and precision, to normal people what’s authoritative is what’s atop the first page of Google results. An SDI that doesn’t confront that fact is one whose Portal/Platform-centric approach is destined for irrelevance.

The most important step forward in spatial data infrastructure this year has been Github adding visualization support for data in the GeoJSON format .  Though originally a platform for managing programming code, Github has evolved into a platform to manage the sharing of data as well.

A Modest Proposal


What does a core set of curated geospatial data files maintained on Github look like?
A lot like Nathaniel Kelso’s Natural Earth project (main site , Github ).  Kelso states his motivation for the project–

“In a time when the web is awash in geospatial data, cartographers are forced to waste time sifting through confusing tangles of poorly attributed data to make clean, legible maps.”

So here’s my proposal: why don’t we take 5% of the taxpayers’ money we’re poised to hand over to a commercial vendor to create the Geospatial Platform and use it post the official US government up-to-date versions of the data found on Natural Earth on Github too.  That way users of data can “fork” and “watch” the repository, etc. ensuring everyone–the government, its citizens, and the private sector busy creating tools/interfaces/services–is working off the latest-and-greatest most authoritative version.  In other words, can the FGDC replicate for a small sliver of the NSDI budget the pro bono efforts of Kelso and his small group of volunteers?

Infrastructure is Easy, Culture is Hard

In one respect throwing money at a vendor to create a white-label version of their cloud-based platform and calling it the national SDI is the easiest option. Because the hard part isn’t standing up a portal, it’s ensuring that the agencies that “own” the various datasets in a common authoritative repository make a credible long-term commitment to keeping key data up-to-date in a complete, transparent manner.

Fresh, accurate, an open government data has never been in higher demand.  Let’s make that the singular focus and de-emphasize the “infrastructure” bit which seems a little too much like a mere continuation of two decades of benefits falling mostly to vendors rather than end-users.


—Brian Timoney


Tunnel photo courtesy of   Sprengstoff72‘s Flickr stream
Shadow photo courtesy of   Kevin Dooley’s Flickr stream