D3 and the Power of Projections
by Brian Timoney
The launch of Google Maps in 2005 brought with it a new way to think about web maps: “tiles”. Lots of tiles. Actually, millions of tiles. The smooth panning and zooming were awesome, but keeping track of all of those 256 x 256px PNG images was, frankly, a chore. Even with a computer. And the purists amongst us chafed as this mongrel projection “web mercator”–not exactly conformal, not really Mercator–became the de facto standard.
So what mapping industry titan would rise up and liberate us from the tyranny of web mercator in the browser?
A guy in California who works for the…The New York Times?
D3.js: Data Driven Documents
D3 is a javascript library that not only does choropleths, proportional symbols, etc. in the browser (no IE 6-8; we can’t wait up forever), but a stunning array of other types of visualizations. Which is essential because even we mappers realize that sometimes the best map isn’t a map. A Swiss-army knife of data-display possibility to complement our everyday cudgeling of points, lines, and polygons.
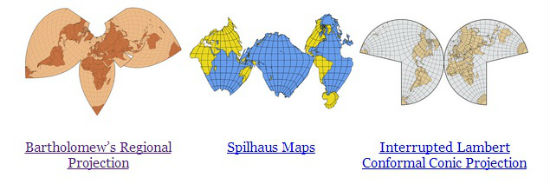
May I Interest You In Some Peirce Quincuncial?
BREAKING: Projections are back in the browser.
And how!
Those of us of a certain age remember when the education crisis wasn’t basic reading and ‘rithmitic but America’s school children staring at Mercator maps and getting distorted impressions of the relative sizes of continents. And being too impressed with Greenland. Now we can dazzle impressionable youth with the manifold ways to display an oblate spheroid on a flat screen.
Or heck, just go all in on a spheroid, and spin it, inside your browser.
Cro$$over Skill$
As map-making goes mainstream, geo professionals need to cultivate a skillset less niche and more in demand by those outside the geo silo. D3–because of its versatility and variety–is much in demand. A fair grasp of it combined with data munging skills, and you’re looking at a $15K bump in market-value (or your money back).
Small Steps, Incremental Absorption
But that $15K isn’t free money. D3 has moving parts and a conceptual framework that needs grokking before the cool stuff happens. Your go-to technique of “COPY-PASTE, TWEAK-‘N-HOPE” isn’t the play here. Fortunately there are a ton of resources and a new book: with patience and lots of view-source-ing, you’ll be in infoviz-creating mode in due time.
The Tyndale Revolution in Online Mapping
D3 will only accelerate the process that Google kicked off in 2005: the radical democratization of cartography on the web. In creating the first English translation of the Bible using the new tools of mass publishing, Tyndale effectively broke up the monopoly of the small, elite, Latin-reading guild. (And got burned at the stake for his trouble–stuff happens.) Geospatial professionals had a sort of monopoly on map-making: complicated software and obscure data formats kept the guild comfortably small. Now we see patient explanations of what a shapefile is geared towards the tech-savvy but otherwise uncredentialed outsider. Anyone with a browser and a text-editor can now make compelling maps and distribute them to the utter ends of the earth. If you’re an industry veteran in this uncertain, sequestered professional environment, you can either devote your energies to pining for a cozy, less demanding past or jump head first into the creative flourishing of a New Golden Age of Cartography that has already arrived.
—Brian Timoney


