MapBrief™

Geography · Economics · Visualization

Daring To Build a Citizen-Centric Homepage: The Philadelphia Story


Over the holiday the City of Philadelphia posted an “alpha” version of its new website and encouraged public feedback: a nice example of customer engagement and iterative improvement.  But also a reminder of how local government webpages fail their would-be users in some very basic ways.  As someone who has seen the local gov web sausage up close, I have feedback.

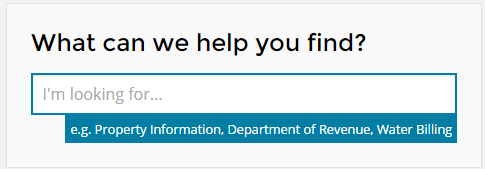
Good Thing #1: A Big, Obvious Auto-Complete Text Entry Box

After 15+ years of googling, this should be a no-brainer.

You know who hasn’t gotten the memo? Three of the four largest cities in the US : New York, Los Angeles, Houston. (Good on you, Chicago). Not having auto-complete on your homepage is not asking your user to find the needle in a haystack, it’s asking the user to find the needle in the haystack while blindfolded.

Good Thing #2: Making Prime Webpage Real Estate Useful

If the top half of the web page is supposed to contain the most valuable, urgent content you absolutely want to get in front of the visitor, then the puzzling decision many cities make is to use this real estate to show you pictures.  Where are you going to go for a slide show of Seattle– Flickr or the Seattle.gov webpage?  But that’s small beer compared to what LA has going on: their oversized slide show includes “Best of The Web” and “Digital Cities” awards. Which, come to think of it, may well be an effective way for LA to communicate that its most distinctive quality is bewildering self-regard.

Where’s The Mayor?

Maybe I’m biased, coming from a city where there have been rumors of prolonged discussion of the relative pixel sizes of the mayor’s photo and the city council’s photo on the homepage, but the size and position of the mayor’s photo seems to be a good indication of either his or her power or the degree of internal sycophancy–I can’t decide which.  Goodness knows that in our age of Facebook/Twitter/Instagram, mayors have other channels with which to assert their brand, so maybe they don’t need to be the first thing a citizen looking for the trash pick-up schedule sees.

What’s Missing?  The Street Address

Look, on the web we’re all narcissists. Impatient ones at that.

So in that autocomplete box on the homepage let residents enter in their address to take them directly to their property information.  Not just their assessments, etc. but also the nearest park, library, police station, school, parking regulations, etc.  Don’t make them hunt for that information on each department’s separate web page:  link outward from their individual property page.

How hard would it be to enable auto-lookup for Philadelphia’s half million addresses?  Well, you can try this simple app I created two years ago for another blog post. Still seems to work, mostly.

*  *  *  *  *  *  *

Let’s be straight:  search engines have made home pages increasingly irrelevant as citizens look to Google first in navigating the informational morass of their local government’s website. But doesn’t this imply that the users who still start with the homepage are in more need of intuitive search tools?

Whatever the case, it’s a positive sign that at least one city is prioritizing the digital needs of its citizens over the prerogatives of glib self-promotion that have too long been the default mode.


—Brian Timoney


Philly photo courtesy of  Jakob Monstrasio’s Flickr stream


Geo In The Browser: Less IT Means This Time It’s Different

Call me a glutton for tedious text, but I enjoy end-of-year lists, predictions-for-next-year, and yes, the annual family newsletters my friends send me around the holidays. So killing time during a not-particularly-intriguing final Sunday of NFL football, I found in the latest GeoHipster post of 2015 prognostications a couple of worthwhile nuggets.

“…the client side will eat more of the server side stack.”

Thus sayeth Tom MacWright of Mapbox.  And I’m inclined to agree since Geo-in-the-browser was a major trend I spotted at the 2014 FOSS4G conference in Portland.

Not so coincidentally, Mapbox recently blogged their new-ish Javascript library Turf (“GIS for web maps“)–that does spatial analysis functions such as buffers inside the user’s browser (as opposed to a remote server or database doing the calculations).  Very cool–especially when a small handful of spatial operations cover a large amount of use cases.  But this?


Now I like smack talk as much as the next guy–hell, I even like hyperbole–but I’m doubtful that “GIS for web maps” is the most effective marketing tack for “assaulting GIS”.

JavaScript in 2014–Echoes of early 2000s Java?

As it happens, I saw this movie the last time around, when the Java community arrived in the early 2000s and rewrote all of geospatial. The dominant architectural paradigm of the time was the three-tier, built on open standards, and the software all shows it.

That from industry wise-man Paul Ramsey (with whom I occasionally agree).  Again, I’m more than a little predisposed to middle-aged curmudgeonly been-there-done-that finger-wagging.  But yet I’m excited about geospatial analysis in the browser.

Why?

Self-interest, mostly.

I Want Less IT in My Life, and So Do My Clients


Even under the most ideal conditions, the coordination costs between IT departments and their internal customers are significant. And conditions are never ideal: we all have our stories–you, me, and every vacant-eyed PM who sits in the chairs pictured above.  But as the outside consultant trying to deliver even a modest solution to a customer, those coordination issues directly impact my bottom line. Negatively.

(Admittedly this says more about my shoddy consulting talents as I’m aware of the fat stacks of cash that await those who figure out how to profit directly from these organizational frictions e.g. <insert large federal government contractor here>.)

In short, if it doesn’t require a server, I can get something to the client quicker and more profitably.  Minus the burden of dealing with their own IT department, my ideal customer will be more likely to embrace iterative development and experimental pilot projects.

(For those of you shouting that The Cloud solves the same problem, trust me, the IT department has an opinion and  even on the cusp of 2015 the middle manager skepticism will be palpable.)

I’m Running This in My Browser: Is It Software or A Web Page?

A taste of what’s to come can be seen in Howard Butler’s plas.io LIDAR viewer.  Just a short time (months?) ago this would have required a software install:  now you can load a not-small LIDAR file, view/manipulate it, and do some analysis all from the comfort of just a single browser tab.  No meetings, phone calls, or emails with the IT department necessary.

Come to think of it, not only will you have to interact less with your IT department, more geospatial capabilities in the browser may also diminish your similarly frustrating interactions with that collective entity known as  “GIS”.

Dare to dream.


—Brian Timoney


Meeting room photo courtesy of  Bankbryan’s Flickr stream


The Elegant, Effective Election Data Visualization That Is Thankfully Not A Map


We occasionally field the suggestion, nay, insinuation, that our posture here at Mapbrief is unduly critical.  Whether it be pie charts, contiguous cartograms, or untucked shirts, our opinions are admittedly fixed. So much so that you might say “dogma”; we say “consistency”.

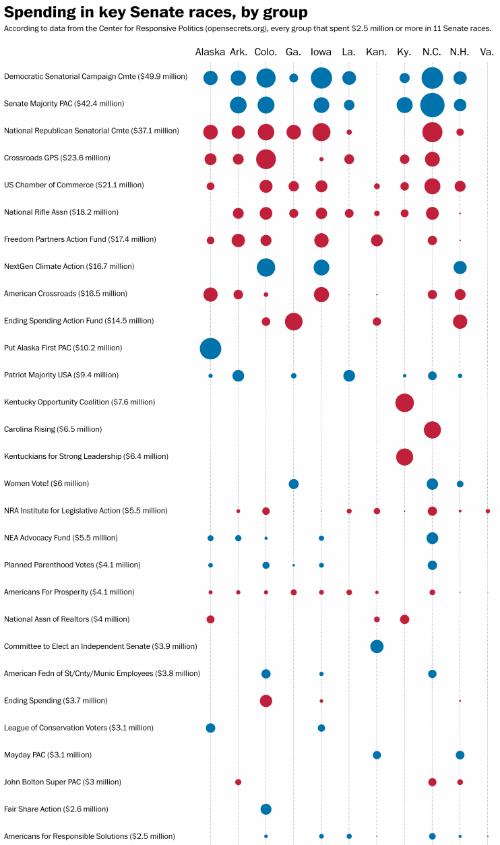
But in the spirit of staying positive, let’s admire this recent graphic from the Washington Post detailing campaign contributions:


Note the five dimensions of information: 1) donor name, 2) total donation,  3) state of Senate race, 4) receiving political party, and 5) relative size of state-level donation. As a bonus, the list is sorted top-to-bottom by total donation.

What makes me especially happy is that I can so clearly picture what this graphic could have been: a map of the US with the 11 states having some choropleth ramp (39 states of “no data”!), with a proportionally sized pie chart atop each state showing the party breakdown.

The horror.

Moral of the story: sometimes the best map is no map.

Great job by the Post team.


—Brian Timoney